This site uses cookies to provide you with a great user experience. By using BondbloX, you accept our use of cookies.
Bond Market News
Treasuries Rally Post 25bp Fed Hike; MapleTree Launches S$ 7Y Green Bond
March 23, 2023
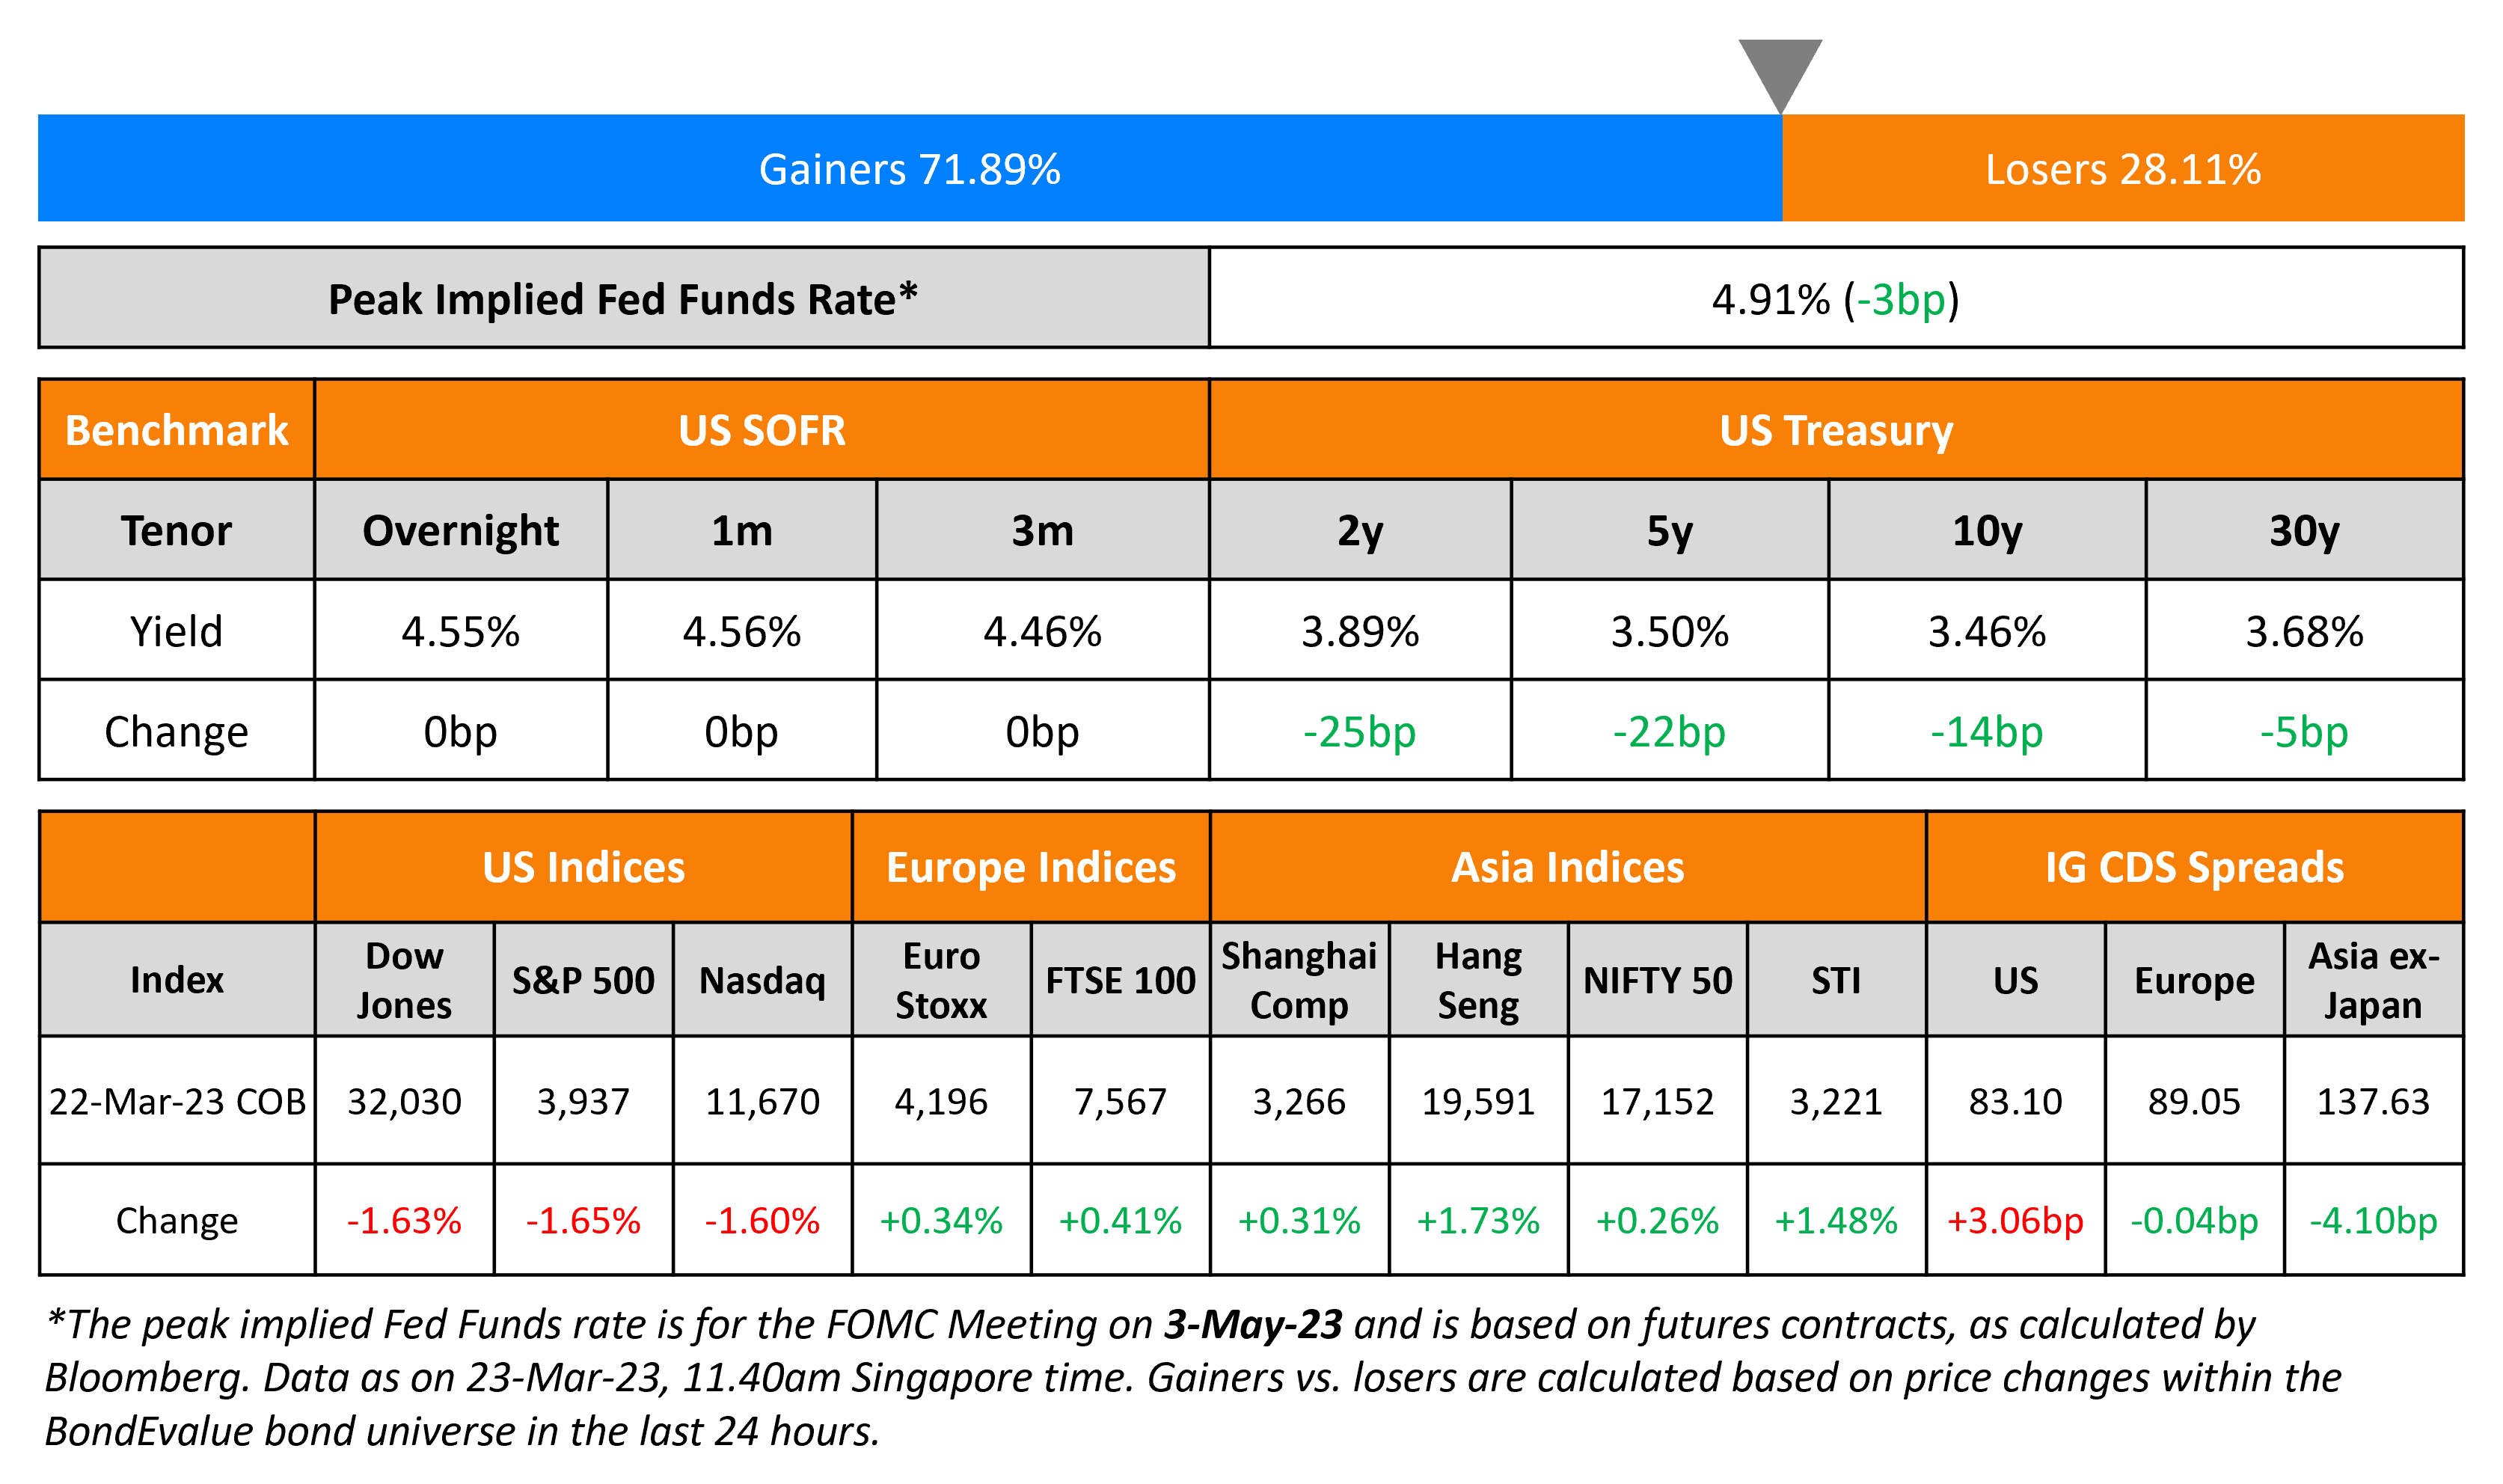
US Treasuries saw a sharp rally across the curve following the Fed’s decision to hike rates by 25bp to a target range of 475-500bp, alongside a dovish dot plot. The US 2Y yield fell over 25bp and the 10Y yield was down 14bp, with the entire curve back below 4%. In terms of commentary on future path of rates, the Fed did away with the phrase “ongoing rate increases” while saying that “additional policy firming may be appropriate”. The Fed’s Dot Plot (shown below) indicated an end-2023 median rate of 5.1% (implying one more hike) post which it expects to hold rates stable through the rest of 2023. It expects to cut rates only next year with an end-2024 median of 4.3%.
While the Fed advised that more Fed tightening may be in store, bond markets think otherwise. CME maximum probabilities show a status quo in May and June, and a 48% chance of a 25bp rate cut in July. The peak fed funds rate was 3bp lower to 4.91%.
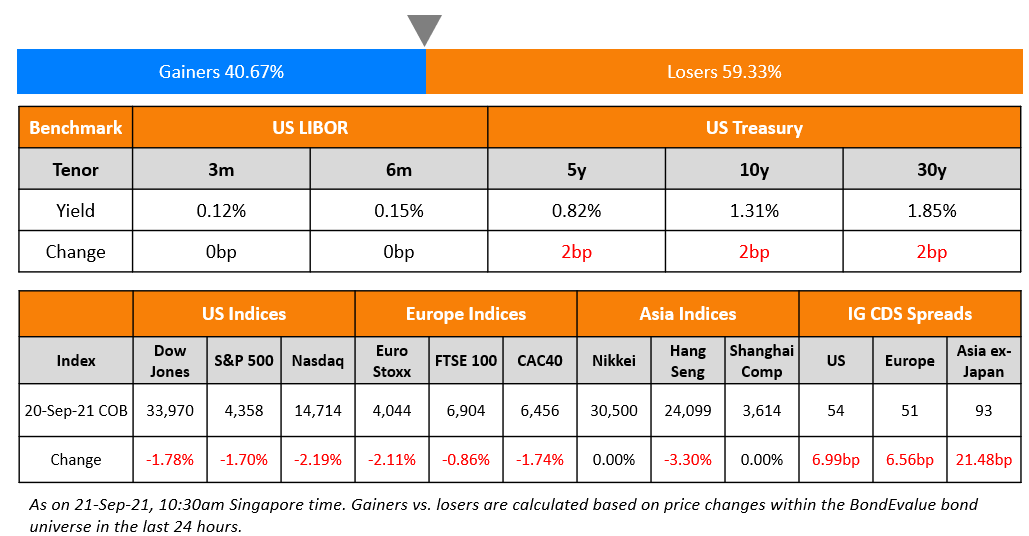
On inflation, the Fed expects core PCE to peak at 3.6% this year and cool-off to 2.6% in 2024. They also expect the unemployment rate to rise to 4.5% this year from the latest reading of 3.6%. Regarding the banking sector, the Fed said that while it would likely slow the economy, it will not lead to a broader financial meltdown. Separately, US Treasury Secy. Janet Yellen said that regulators were not looking to provide a “blanket” deposit insurance to stabilize the US banking system. US IG and HY CDS spreads widened 3bp and 20.6bp respectively. The S&P and Nasdaq dropped by 1.7% and 1.6% respectively.
European equity markets were slightly higher with most major indices up ~0.3%. European main CDS spreads were flat while Crossover spreads tightened 1.6bp. Asia ex-Japan CDS spreads tightened by 4.1bp and Asian equity markets have opened with a negative bias this morning.
-1.png)
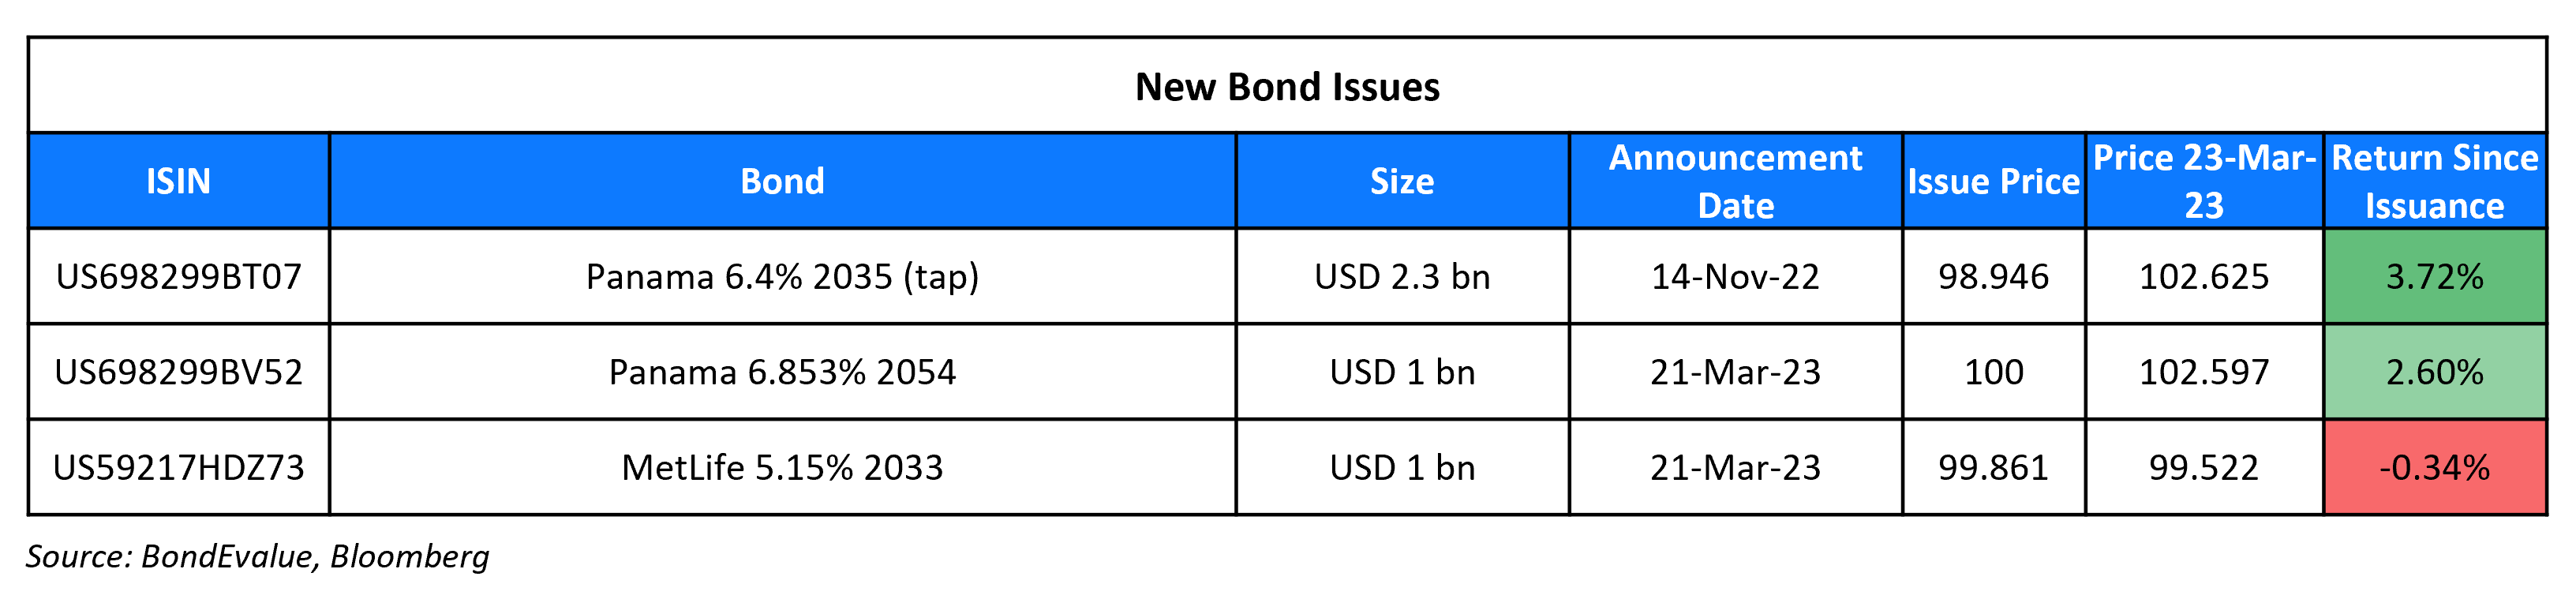
New Bond Issues
- Mapletree Pan Asia Commercial Trust S$ 7Y green bond at 4.5% area
New Bonds Pipeline
- KNOC hires for $ 3Y, 5Y and/or 10Y bonds
- Shinhan Bank hires for $ senior bond
- REC hires for $ Long 5Y Green bond
- Qatar plans for $ bond
Rating Changes
- Fitch Upgrades Ghana’s Long-Term Local-Currency IDR to ‘CCC’
- Moody’s downgrades Liberty Interactive LLC’s corporate family rating to B3
- Moody’s reviews Huarong AMC’s ratings for downgrade
- Moody’s withdraws Oriflame’s ratings
- Moody’s affirms ratings of 10 Saudi Banks and changes deposit rating outlook to positive on nine
Term of the Day: Dot Plot
The Fed dot plot is a visual representation of interest rate projections of members of the Federal Open Market Committee (FOMC), which is the rate-setting body within the Fed. Each dot represents the Fed funds rate for each year that an anonymous Fed official forecasts. The dot plot was introduced in January 2012 in a bid to improve transparency about the range of views within the FOMC. There are typically 19 dots for each year, representing the median rate of each voting member on the committee.
Talking Heads
On MAS abiding by credit hierarchy, putting AT1 and T2 claims ahead of equity
- Equity holders will absorb losses before holders of Additional Tier 1 (AT1) and Tier 2 capital instruments
- Creditors who receive less in a resolution compared to what they would have received had the FI been liquidated would be able to claim the difference from a resolution fund that would be funded by the financial industry.
- Creditor compensation framework will also apply in the exceptional situation where MAS departs from the creditor hierarchy in order to contain the potential systemic impact
- FIs that offer or distribute AT1 bonds are expected to make accurate and clear disclosures of key product features and risks to investors
On Fed’s Decision To Weigh on Asia Stocks and Help Bond Rally – Strategists
Chamath De Silva, a senior fund manager for Betashares Holdings
“Asian markets will likely take the lead from the US, so bonds up, stocks down, although the weakness in Asian equities might be tempered by a weaker US dollar…The big end-of-cycle rallies in bonds have generally followed a pause”
Kellie Wood, deputy head of fixed income at Schroders
“ook for higher yields to get longer rates. We also added credit protection to position for a greater risk of recession being priced into credit markets”
Redmond Wong, strategist at Saxo Capital Markets
“Smaller banks are likely to face a flight of deposits…Bank lending will slow further or even contract and bring about a recession. Treasury yields may fall further and Treasuries, in particular the front end of the curve, are a buy”
On Powell Saying Fed Baffled by SVB Collapse Despite Warnings
“The question we were all asking ourselves over that first weekend was, ‘How did this happen?…We’re doing the review of supervision and regulation. My only interest is that we identify what went wrong here”
On Warning of Accelerated Deposit Outflows After Fed Decision – Bill Ackman, CEO Pershing Square
“We have gone from implicit support for depositors to @SecYellen explicit statement today that no guarantee is being considered with rates now being raised to 5%…I would be surprised if deposit outflows don’t accelerate immediately… A temporary system-wide deposit guarantee is needed to stop the bleeding”.
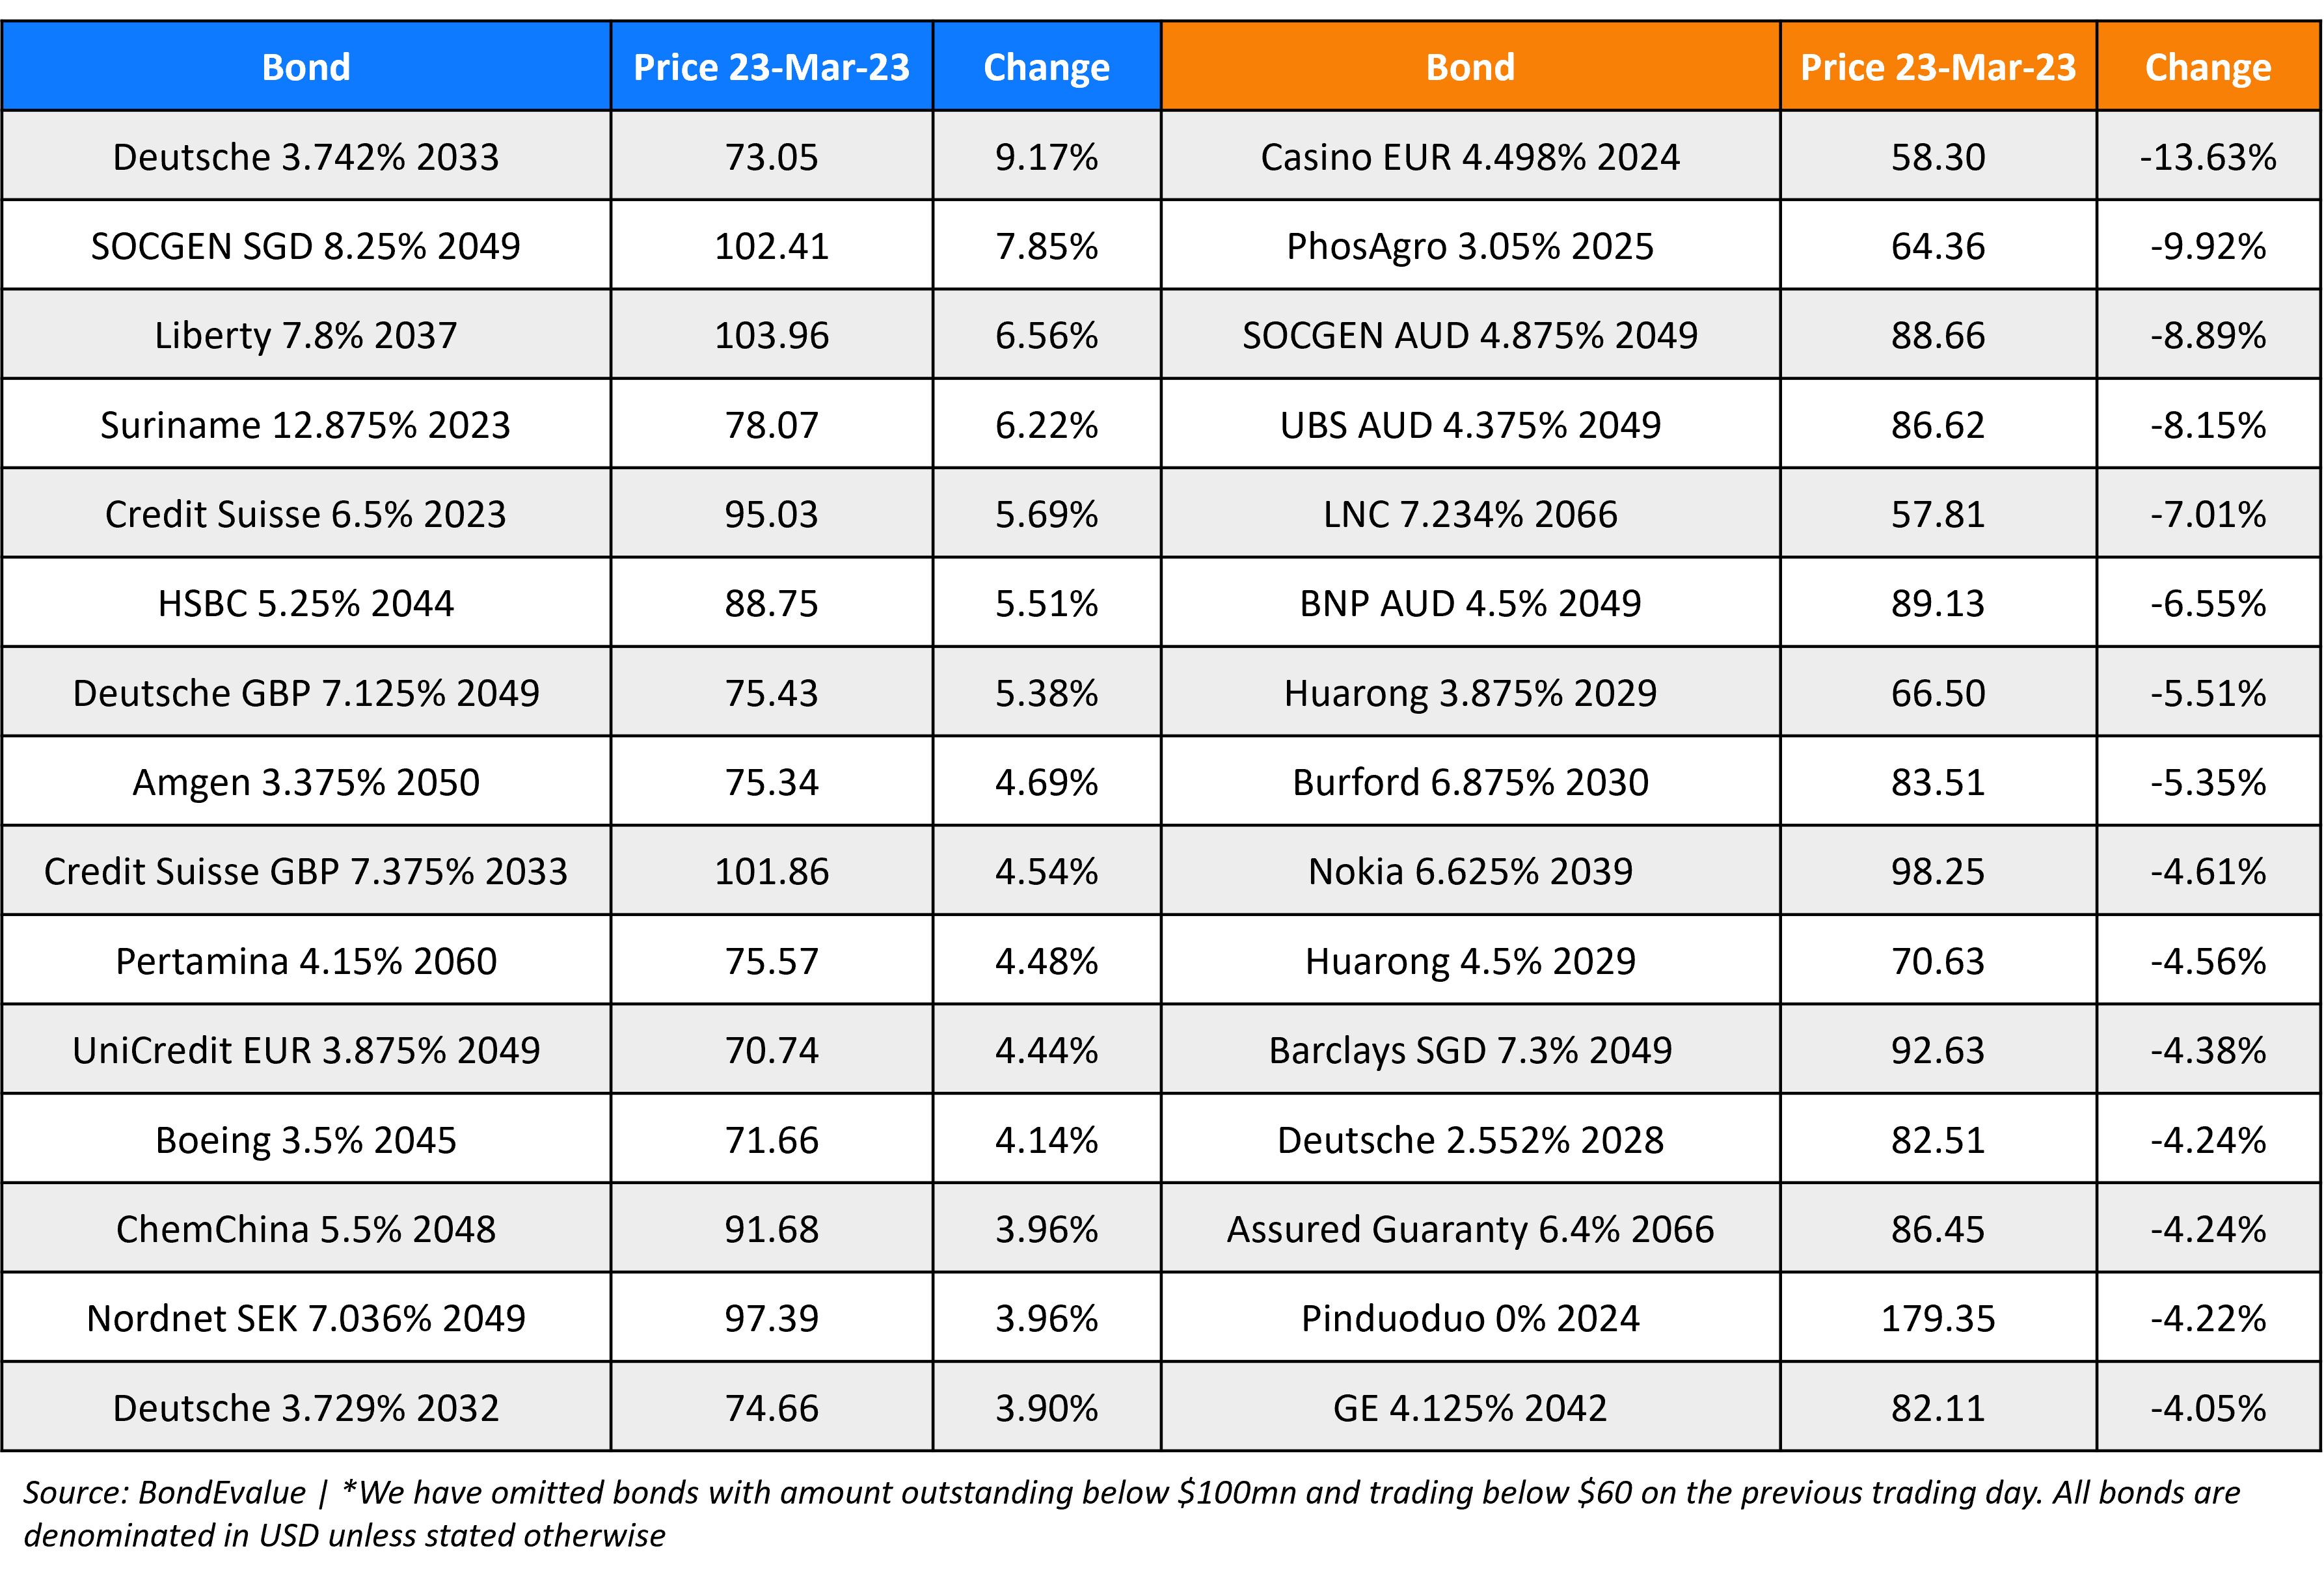
Top Gainers & Losers – 23-March-23*
Go back to Latest bond Market News
Related Posts:


BondbloX Pte. Ltd. is regulated by the Monetary Authority of Singapore as a Recognised Market Operator ("RMO") and exempted from Section 49(1) of the Securities and Futures Act (Cap. 289) ("SFA") under Section 49(7) of the SFA.