We use cookies to improve your experience. By using BondbloX, you agree to our use of cookies.
Portfolio Manager
The Need for a Bond Portfolio Manager Tool

In today’s volatile markets, it is essential for bond investors to be able to track their bond investments on a regular basis. This can be hard to do given the over-the-counter (OTC) nature of bond trading, due to which bond prices are hard to find. Adding to investors’ woes is the lack of a comprehensive Portfolio Management tool to track their consolidated bond investments with relevant P&L metrics.
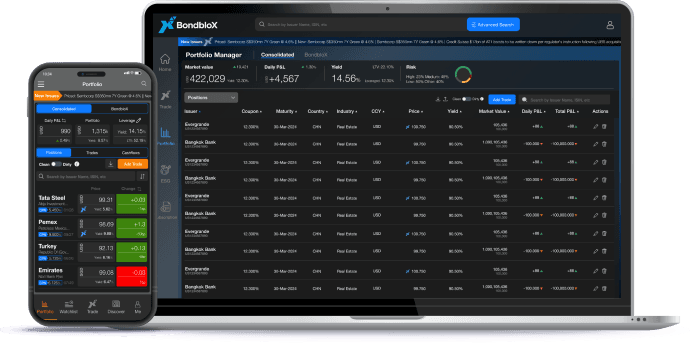
BondbloX’s Portfolio Manager tool solves these problems, enabling investors & advisors to track the latest bond prices/yields along with their bond portfolio holdings & key metrics – conveniently via a Mobile & Web App. The tool allows you to log your buy/sell bond trade in less than a minute, track daily & total profit/loss, the latest market value, accrued interest & cashflows. Investors can thus use the Portfolio Manager tool to add their consolidated holdings across multiple private banks for easy tracking.
Using the Portfolio Manager Tool
Positions
Add Trade
Trades
Cashflows
Positions main screen
View broad portfolio details like daily change, mark-to-market value of the portfolio, portfolio returns including the use of leverage.
Clean Price
Disable the toggle to view clean prices of individual bonds and the overall clean market value of the portfolio that excludes accrued interest and coupons received.

Bond Details
View each bond’s price and yield in your portfolio along with the daily change. Also view the total mark-to-market investment value of each bond along with daily changes.
Dirty Prices
Enable the toggle to view dirty prices of individual bonds and overall value of the portfolio that includes accrued interest and coupons received.
Positions

Positions main screen
View broad portfolio details like daily change, mark-to-market value of the portfolio, portfolio returns including the use of leverage.
Clean Price
Disable the toggle to view clean prices of individual bonds and the overall clean market value of the portfolio that excludes accrued interest and coupons received.
Bond Details
View each bond’s price and yield in your portfolio along with the daily change. Also view the total mark-to-market investment value of each bond along with daily changes.
Dirty Prices
Enable the toggle to view dirty prices of individual bonds and overall value of the portfolio that includes accrued interest and coupons received.
FAQs
How do you add bonds to your portfolio?
On the Mobile app, you can add bonds by going to the ‘Portfolio’ page and clicking on the button ‘Add Trade’. This will allow you to search for the bond of your choice post which you can add the specific details and click on ‘Buy’. This will load the bond into your portfolio.
On the WebApp, you can search for the bond of your choice in the search bar and then click on the ‘+Add to Portfolio’ button once the bond loads.
One thing to note when adding a bond is to input the ‘Quantity’ in terms of the minimum denomination. For example, if the minimum denomination of Bond A is 200,000 and you own 200,000 notional of Bond A, the quantity you should enter is 1. Similarly, if you own 300,000 notional of Bond A, the quantity you should enter is 1.5.
What is the Clean/Dirty toggle button?
How can I check my overall investment position in each bond?
On the Mobile app, under the ‘Portfolio’ page, click on the ‘Positions’ header. Under this, you have the list of your bond with its price, yield and daily change details. Clicking on the price of the bond will load your overall mark-to-market investment position. Re-clicking on the investment position will again take you back to the earlier screen with the price, yield and change.
On the WebApp, go to the ‘Positions’ tab under the ‘Portfolio’ page. Here, the “Market Value” column highlights the mark-to-market investment position of each bond. The values under this which are grayed out refer to the minimum denomination of the bond.
How do I edit or delete bonds added to my portfolio?
To edit/delete bonds on the Mobile app, click on the ‘Trades’ tab in the ‘Portfolio’ page and click on the ‘Trade Price’ or ‘Trade Amount’. This will enable you to edit the specific trade related details of the bond in focus. To delete a trade, swipe left on the specific bond, under the ‘Trades’ tab and click on <Delete>
To edit/delete bonds on the WebApp, go to the ‘Trades’ tab under the ‘Portfolio’ page. On the right hand side of the page, there are two columns titled “Edit” and “Delete”. Click on the pencil or bin icons of the bond to be updated and edit the fields.
If I buy a bond and add more units of the same bond or sell the bond, how does it reflect on the app?
The ‘Positions’ tab shows the net position of each bond having accounted for all the trades.
Can I download portfolio data from my mobile app?
Portfolio specific data can not be downloaded from the mobile app. It can however be downloaded onto MS Excel from the WebApp using the "download" icon in the ‘Portfolio’ page, next to the “Include AI & Coupons” toggle button.
What trade details can I edit under the Trades tab?
You can edit the following:
- Trade price of the bond (price at which you bought/sold the bond)
- Trade Date of the bond
- The number of bonds based on the minimum denomination shown next to it
- The fees paid in basis points
Where is the Portfolio tab located in the mobile and web applications?
On the Mobile app, the ‘Portfolio’ page is located at the bottom of the screen. On the WebApp, it is located on the left side toolbar, under the ‘My Account’ tab.
What is leverage? What is LTV (Loan to Value)?
Leverage refers to the amount of money borrowed to buy a bond. The amount borrowed need not necessarily be in the same currency that the bond is denominated in. The BondbloX app allows for this provision and adjusts the values based on the forex rate on the day. The cost of borrowing refers to the interest rate to be paid while borrowing money. The leveraged yield refers to the total yield of the portfolio after accounting for the use of leverage. Loan-to-value refers to ratio between the amount of loan taken/borrowed divided by the mark-to-market dirty market value of the investment.
How is the invested amount calculated?
The invested amount is calculated as the following:
(Purchase Price + Accrued Interest on Purchase Date) * ((Quantity * Minimum Denomination) / Redemption Value) * (1 + Fees/10,000)
Where can I see the cash flows from a bond?
The cashflows due from each of the bonds in your portfolio can be viewed under the ‘Cashflows’ tab. Do note that previous cashflows from the bond do not appear here, but are included in the value of your investment which is visible under the ‘Positions’ tab.
What does Fees refer to, in the Trades tab?
Fees refers to basis point value that a buyer pays to the seller of the bond when a transaction takes place.
Can I input a fraction while adding the number of bonds?
Fractional bonds are not yet standard in the market. With the advent of the BondbloX Bond Exchange (BBX), you can now input fractional units of bonds. For example, an individual may buy 0.5 units of a 200,000 minimum denomination bond and thus he/she can input 0.5 under the “Number of Bonds” field whilst adding their trade.
Our Awards


BondbloX Pte. Ltd. is regulated by the Monetary Authority of Singapore as a Recognised Market Operator ("RMO") and exempted from Section 49(1) of the Securities and Futures Act (Cap. 289) ("SFA") under Section 49(7) of the SFA.