We use cookies to improve your experience. By using BondbloX, you agree to our use of cookies.
Bond Market News
Q2 2023: Mixed Quarter with 54% of Dollar Bonds Lower; HY Bonds Outperform IG Amid Hawkish Fed
July 3, 2023
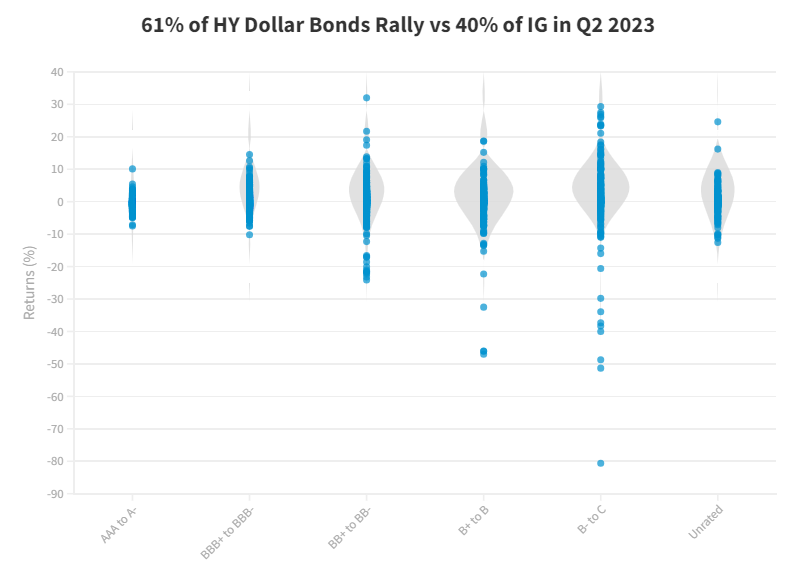
The second quarter of 2023 was a mixed one with 54% of dollar bonds in our universe delivering a negative price return (ex-coupon). This compares to a broadly cheerful Q1 when 75% of dollar bonds delivered a positive price return (ex-coupon). Within our dollar bond universe, High Yield (HY) bonds outperformed Investment Grade (IG) bonds – 61% of HY dollar bonds ended the quarter in the green vs. 60% of IG bonds that were in the red. Looking at the performance of bond indices, most regional indices traded marginally higher in Q2 2023. The LatAm space saw the biggest rise, up by 2.3% followed by the US HY index that was up over 1.5%. The Asia HY region underperformed, down 0.7% following the dip in dollar bonds of Chinese property developers.
US economic data continued to show considerable strength through the quarter. Non-farm Payrolls (NFP) was higher than expected across the months and wage inflation was sticky at 4.4%. Besides, while CPI trended lower towards 4%, core inflation remained sticky through the quarter at 5.3-5.6%. Besides, other macro data points including soft data like PMIs, consumer confidence and hard data like GDP, retail sales and durable goods orders continued to indicate a solid economy thereby raising prospects of further rate increases by the US Federal Reserve. At the beginning of the quarter, markets were only pricing-in a single rate hike by the Fed followed by rate cuts towards the end of the year. The Fed hiked rates by 25bp in May and as the quarter progressed, the Fed then paused in June and has now guided for 50bp of more rate increases till the end of the year. Jerome Powell also provided a hawkish stance with the market pricing out rate cuts by the Fed in 2023.
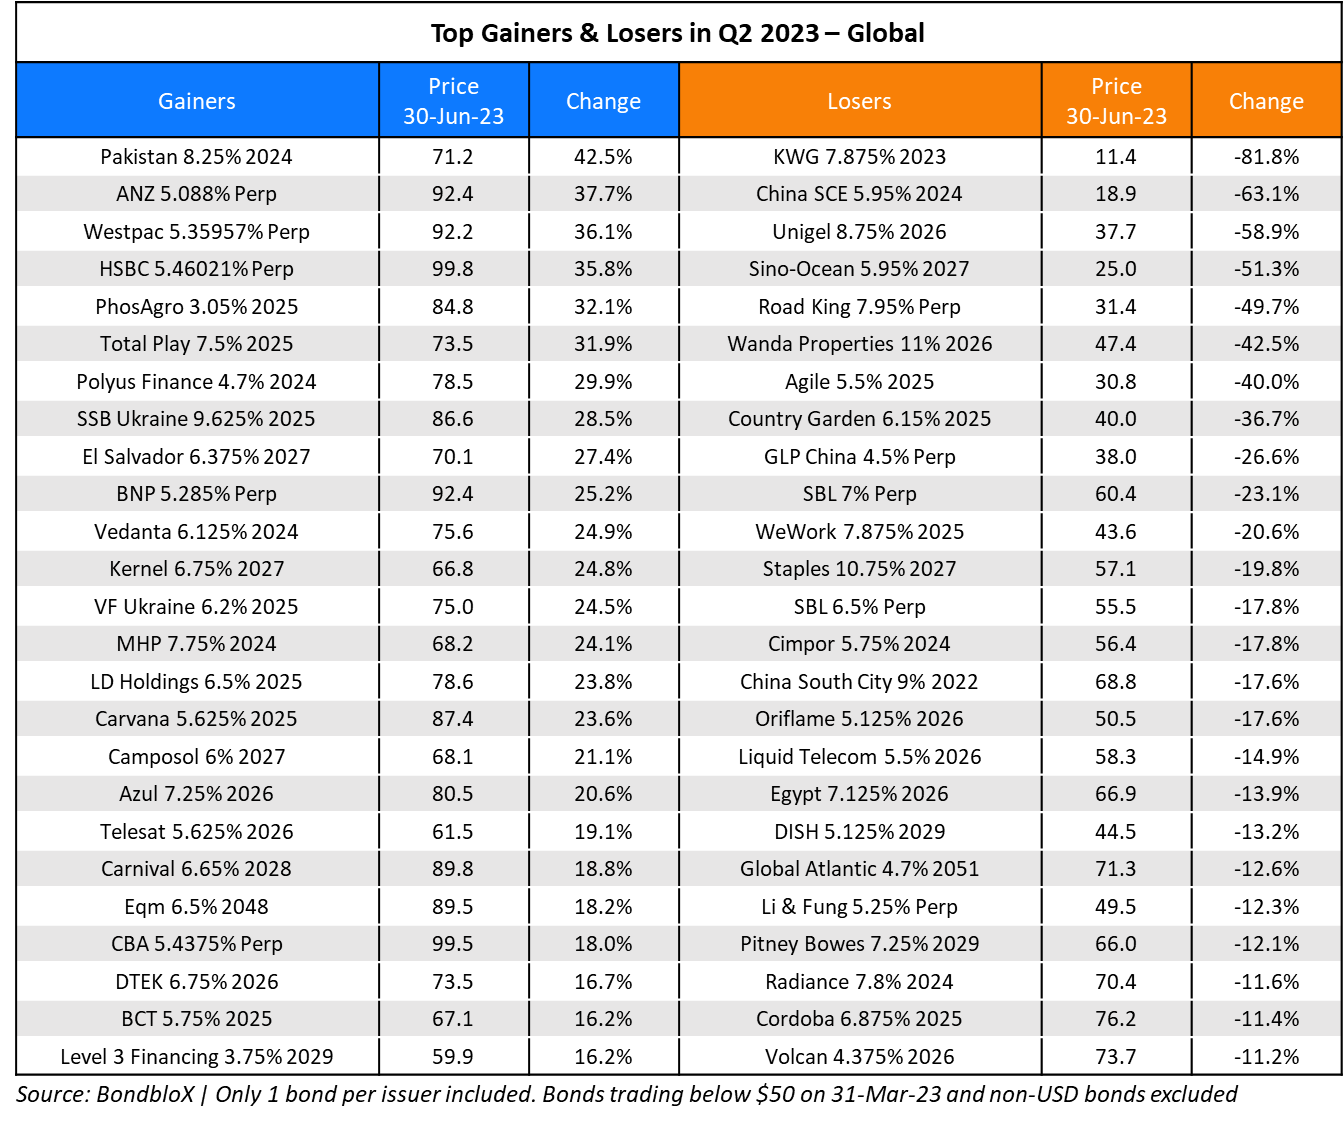
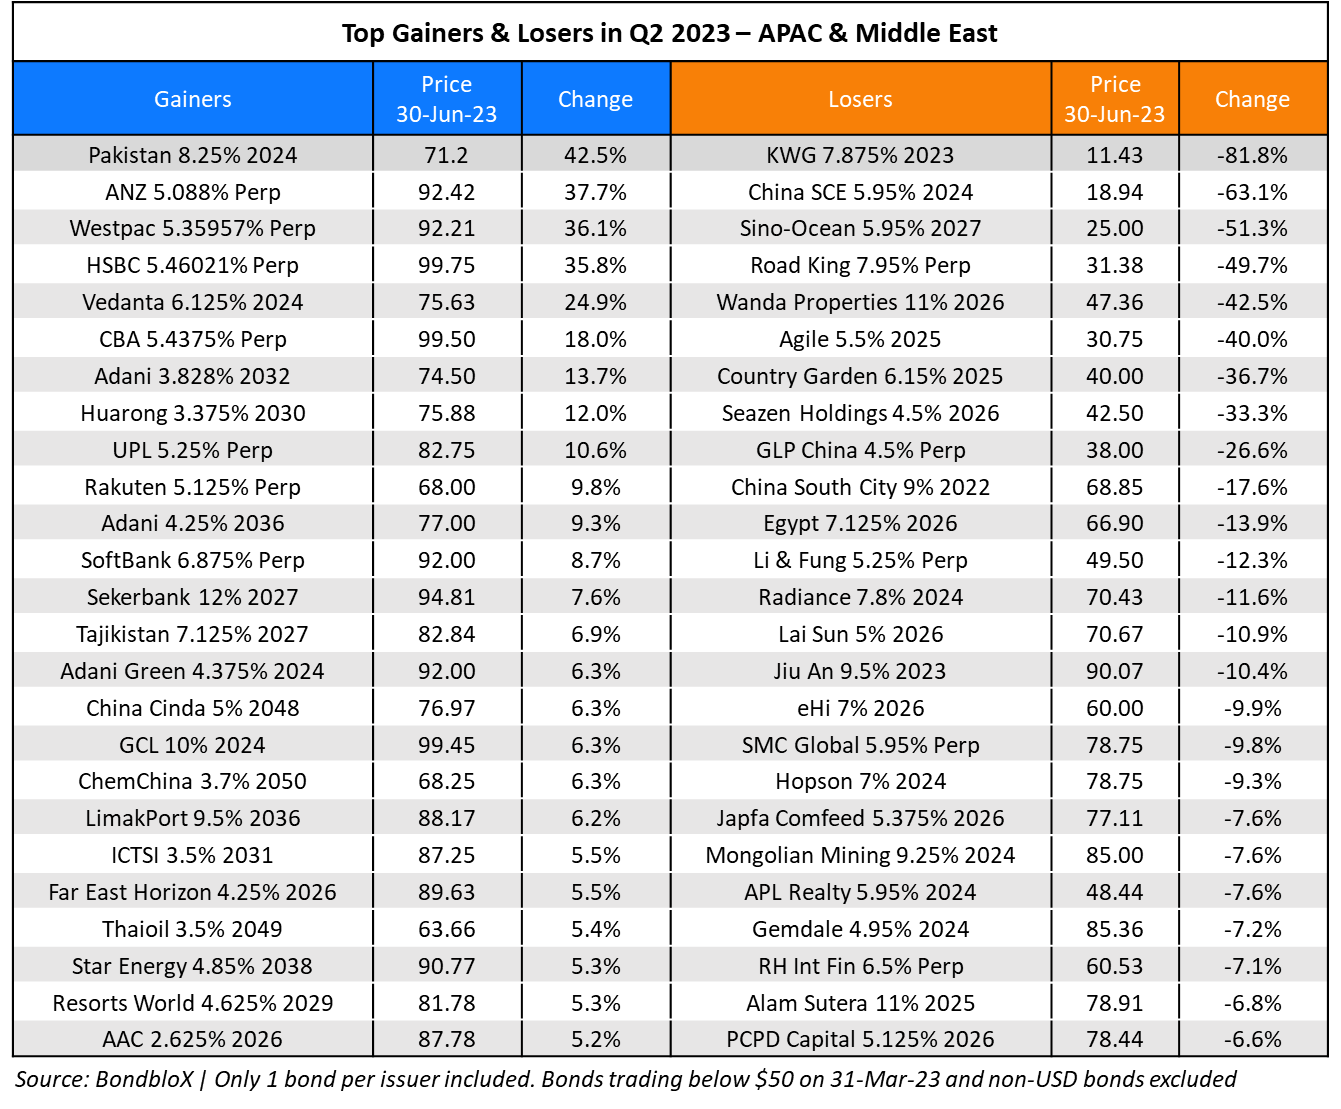
Given this backdrop, the US Treasury yield curve shifted higher particularly with the 2Y yield up by a massive 87bp during the quarter. In comparison, the 10Y yield rose 37bp, thus leading to a flattening and further inversion in the curve. The duration sensitive IG sector thus underperformed the HY segment. Among the noteworthy gainers in the IG space, dollar bonds of Adani Group rallied over 10% as the company improved its financial metrics alongside news of new funding. Besides that, the IG gainers and losers lists were a mixed bag - some longer-dated bonds like those of Allianz, AIA, Nippon, Sumitomo, Tencent etc. were marginally higher by over 3% during the quarter. Other long-dated bonds of Coca-Cola, Pacificorp, Qualcomm etc. were down 5-7%. EDF's dollar bonds were among the notable losers, down ~8% as the company warned of a loss due to strikes.
In the HY space, Vedanta's dollar bonds rallied over 24% in Q2 as the company redeemed its dollar bond and gathered funding to improve its liquidity position. Carvana’s dollar bonds rallied over 20% after reports that their Q2 2023 financial results would be much better than forecasted, causing a surge in their bond prices. American company Lumen’s bonds were up over 7% following its partnership with Microsoft and Google to create a new network interconnection ecosystem called ExaSwitch. Huarong’s bonds also rallied over 7% as a result of the downgrading of its senior unsecured notes from investment grade to high yield territory, causing a surge in demand from high-yield funds as Huarong is considered to be one of the “highest-quality” names in the sector. Among the losers, Chinese property developers filled the list - KWG defaulted on its dollar bonds and concerns about Wanda spilled over to other developers like Sino-Ocean, COGARD, China SCE, Road King and others. Besides, SMC Global’s dollar perps slid by about 10% amid continued concerns about a funding shortfall. WeWork’s bonds also dropped over 20%.
Select EM sovereign bonds saw a strong performance in Q2. El Salvador’s sovereign bonds rallied by 25%, followed by Belarus at 17% and Bolivia at 16%. Other notable gainers include Zambia, whose bonds rallied 15% following its $6.3bn successful debt restructuring deal. Nigeria’s dollar bonds rallied over 11.5% following the election of President Bola Tinubu and the ousting of its central bank governor, with a promise to scrap fuel subsidies and overhaul its exchange rate system. Sonal Desai, CIO for Franklin Templeton Fixed Income said, "I would note that frontier markets are always gonna come with risk. But we still find attractive opportunities in part because some of the valuations are so extreme."
Below is a violin chart of returns across the IG and HY spectrum. Hovering over the dots shows specific bonds and their returns across the rating categories.

Issuance Volumes
In Q2 2023, global corporate dollar bond issuances stood at $593bn, 17% lower than the prior quarter which was at $718bn. In comparison to Q2 2022, issuance volumes were 10% higher. Issuance volumes were primarily helped by May, which saw $227bn in new bond deals.
Asia ex-Japan & Middle East G3 issuances in Q2 2023 stood at $50.5bn, 42% higher than that of Q1 2023, but 10% lower than that of Q1 2022. 80% of the volumes came from IG issuers while HY contributed to 18% of deal volumes.
Largest Deals
The largest deal globally was led by Pfizer’s jumbo $31bn eight-tranche issuance, the fourth largest bond deal ever, to finance a portion of its Seagen merger. Large banks also contributed to the largest issuances in the quarter - BofA raised $8.5bn via a two-part deal, Morgan Stanley raised $7.5bn via a three-tranche deal, Barclays's $4bn via a two-part issuance and Wells Fargo with a single issuance worth $3.75bn. Other large deals included Meta’s $8.5bn five-trancher, Merck's $6bn six-trancher and Walmart's $5bn via a five-trancher.
In the APAC & Middle East region, the largest deals were led by the Gulf - Saudi Government’s $6bn six-trancher, Saudi Electricity’s $2bn dual-trancher and TAQA’s $1.5bn two-trancher topped the largest deals. Besides, Westpac’s $1.75bn covered bond issuance, Eximbank China and Khazanah’s $1.5bn issuances and Sydney Airport’s €1bn deal led the deal volumes.
Top Gainers & Losers
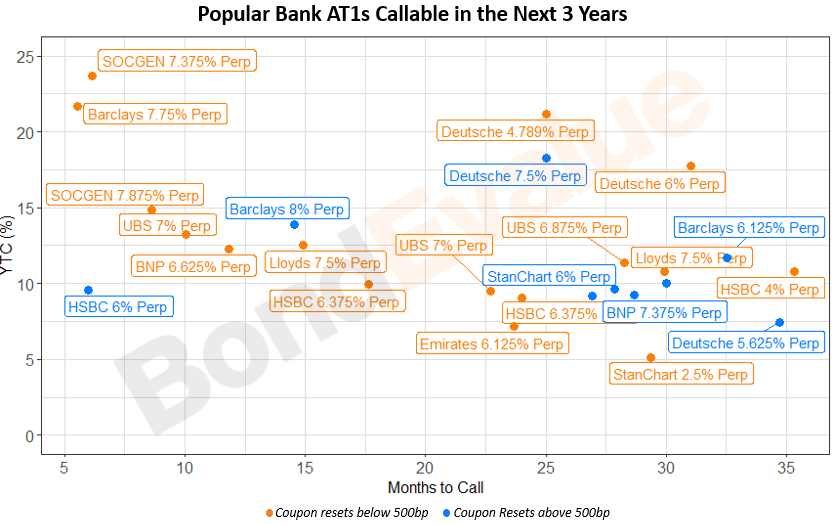
Bank AT1s performed well during the quarter. This comes after AT1 bonds dropped sharply in March following the write-down of Credit Suisse's (CS) AT1s that eroded investors’ confidence. In Q2, following announcements by some banks to call back their AT1s, markets regained confidence. In the APAC region, Australia’s AT1s led with a median return of 3.3%, followed by Thai and Indian AT1s returns of over 3.2%. In Europe, most of its AT1s rallied, with 175 of the 191 bonds in our universe generating a positive price return. Among the top European AT1 gainers, Deutsche Bank’s AT1s rallied between 7-13%. Deutsche Bank’s AT1s sold-off in the wake of spillover risks following Credit Suisse’s downfall, having been considered among the weaker European big banks. However as markets stabilized amid the bank’s solid results, its AT1s recovered and led the gainers in this space. StanChart’s AT1s were also among the top performers, rallying over 6% over the past quarter. StanChart called back their $1bn 7.75% AT1s in early April, leading to confidence over its notes being called with sufficient liquidity. Similarly, SocGen’s AT1s also rallied over 6%.
Looking at Tier 2 bonds, the grandfathered notes [can we briefly explain grandfathered here?] of select banks generated impressive returns in Q2 after decisions to call them back. Five Tier 2 grandfathered bonds rallied by ~35%, significantly higher than the non-grandfathered Tier 2 bonds that were flat. These grandfathered bonds were issued in 1986 and include CBA’s 5.4375% Perp, BNP’s 5.285% Perp, HSBC’s 5.46021% Perp, Westpac’s 5.35957% Perp and ANZ’s 5.088% Perp. Among the top 25 gainers for non-grandfathered T2 bonds, Piraeus Bank’s bonds were among the highest with gains between 7 and 12%. Deutsche Bank and StanChart's bonds too were among the gainers higher by about 4%.
Go back to Latest bond Market News
Related Posts:
Bond Yields – Explained
December 26, 2024
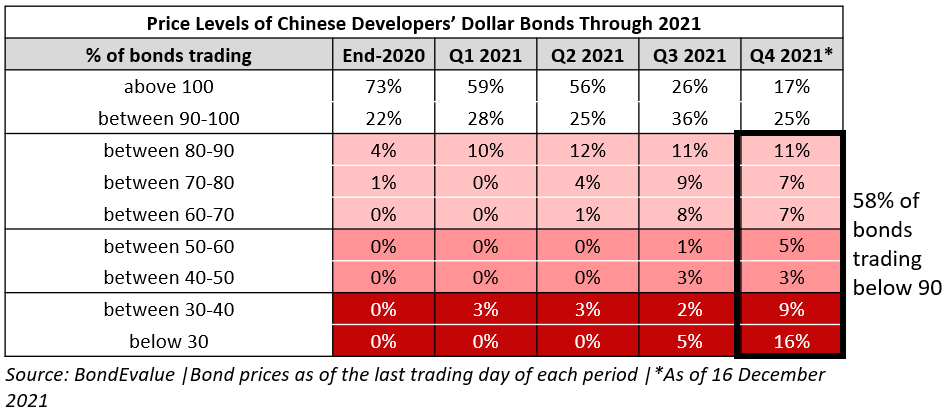
2021 Recap: China Real Estate – When Hope Went Up In Smoke
December 20, 2021
Finding Value in Popular Bank AT1 & Tier 2 Bonds
April 5, 2023
Our Awards


BondbloX Pte. Ltd. is regulated by the Monetary Authority of Singapore as a Recognised Market Operator ("RMO") and exempted from Section 49(1) of the Securities and Futures Act (Cap. 289) ("SFA") under Section 49(7) of the SFA.