This site uses cookies to provide you with a great user experience. By using BondbloX, you accept our use of cookies.
Bond Market News
Treasuries Sell-Off on Hawkish FOMC Rate Cut
December 19, 2024

.png)
US Treasuries sold-off sharply yesterday with yields soaring higher by 10-13bp across the curve after the FOMC meeting. The Fed cut the policy Fed Funds range as expected, by 25bp to 4.25-4.50%. However, this was not a unanimous decision as the FOMC voted 11-1, with Cleveland Fed President Beth Hammack voting against the rate cut. Fed Chairman Jerome Powell said that interest rates were still restraining economic activity and that the Fed remains on track to further reduce rates. However, he added the Fed can be “more cautious” in considering further rate adjustments, given that the policy stance is now significantly less restrictive than before. He further noted that 2024 inflation forecast had “kind of fallen apart” with the committee dialing back on expectations for rate cuts in 2025.
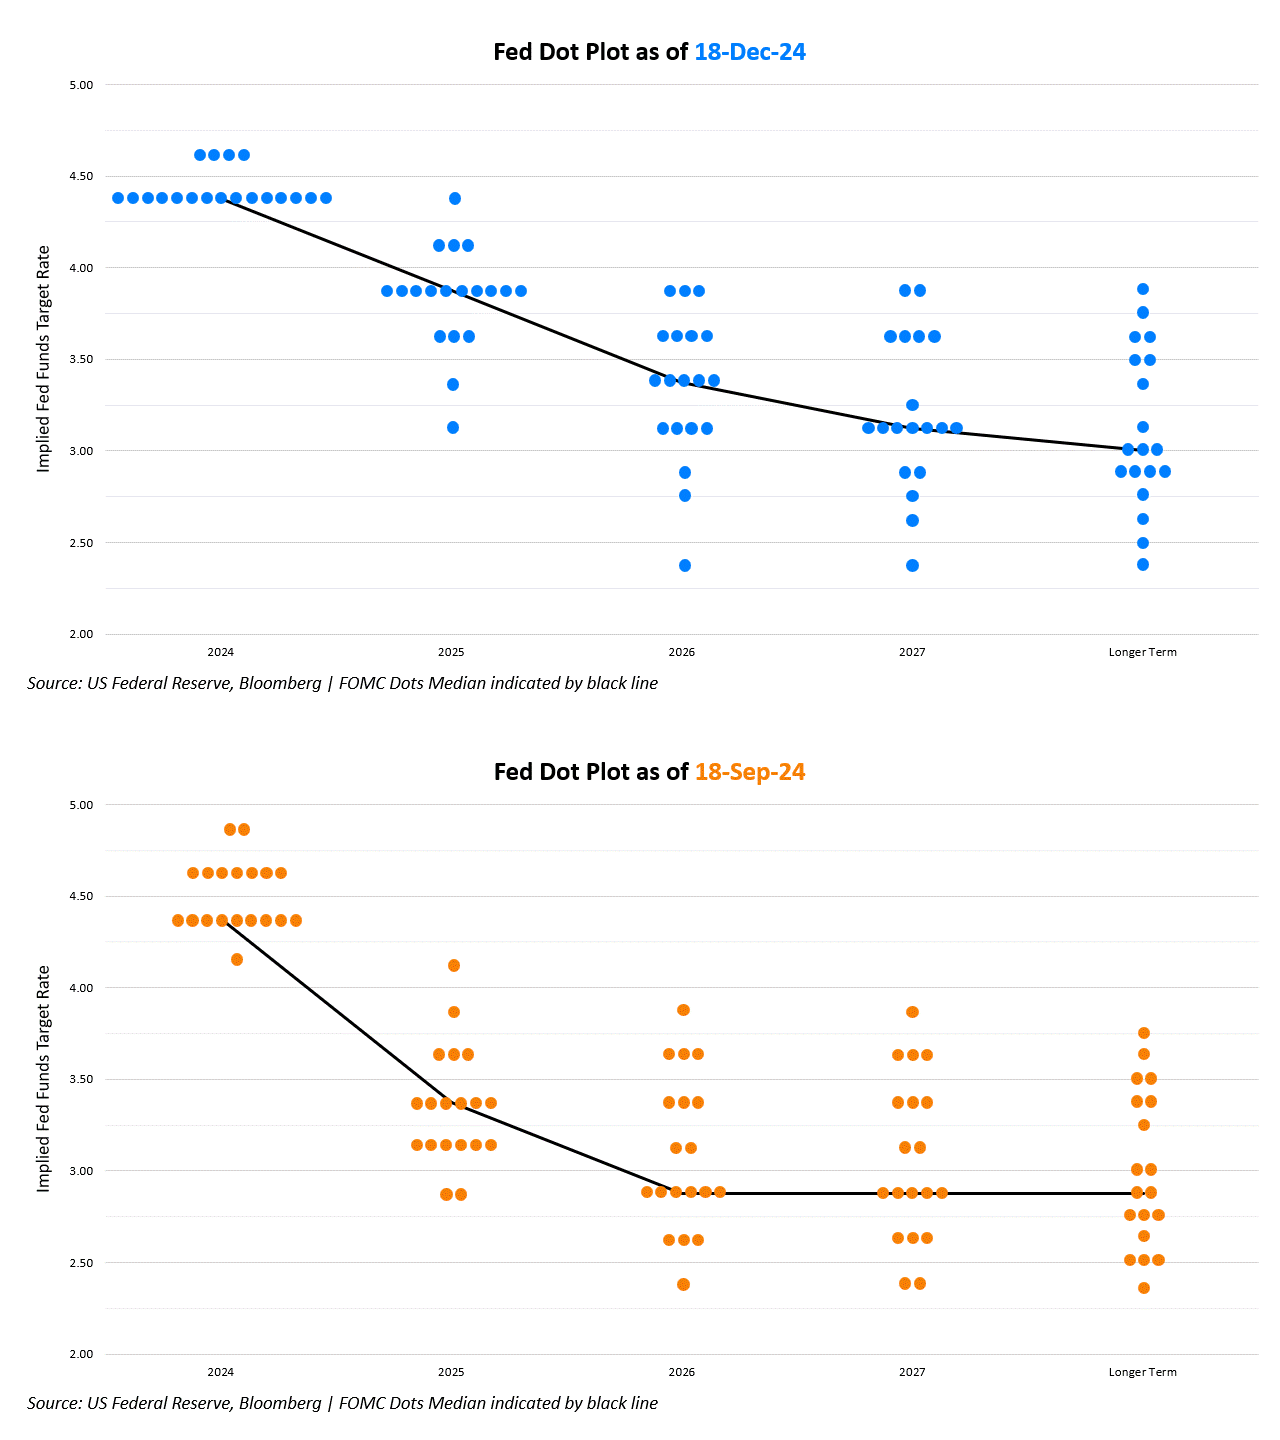
The Fed’s dot plot forecasted the benchmark rate at 3.9% in 2025 (vs. September’s 3.4% projection), indicating 50bp in total rate cuts next year. The Fed’s Summary of Economic Projections (SEP) also showed that officials expected inflation to remain sticky with their Core PCE projections at 2.5% and 2.2% in 2025 and 2026 respectively (vs. 2.2% and 2.0% in Septembers’ forecast).
US IG and HY CDS spreads widened by 2.5bp and 17.4bp respectively. Looking at US equity markets, the S&P and Nasdaq closed 3% and 3.6% lower. European equities ended higher. In terms of Europe’s CDS spreads, the iTraxx Main and Crossover spreads widened by 0.1bp and 1.4bp respectively. Asian equities have opened in the red this morning, following US bourses. Asia ex-Japan CDS spreads were 3bp wider.
New Bond Issues

Rating Changes
-
Continuum Green Energy Upgraded To ‘BB-‘ On Improving Cash Flows; Outlook Stable
-
Moody’s Ratings upgrades Buckeye’s CFR to Ba2, stable outlook
-
France-Based Satellite Operator Eutelsat Ratings Lowered To ‘B-‘ On Mounting Competitive Pressure; Outlook Stable
-
Fitch Downgrades CHEPLAPHARM to ‘B’; Outlook Stable
-
Fitch Revises Oman’s Outlook to Positive; Affirms at ‘BB+’
-
Fitch Revises Outlook on Asahi Life to Positive; Affirms IFS at ‘A-‘
-
Moody’s Ratings affirms Camposol’s B3 ratings; outlook changed to positive
Term of the Day: Fed Dot Plot
The Fed dot plot is a visual representation of interest rate projections of members of the Federal Open Market Committee (FOMC), which is the rate-setting body within the Fed. Each dot represents the Fed funds rate for each year that an anonymous Fed official forecasts. The dot plot was introduced in January 2012 in a bid to improve transparency about the range of views within the FOMC. There are typically 19 dots for each year, representing the median rate of each voting member on the committee.
Talking Heads
On Macro a must-have for hedge fund investors betting on 2025 market swings
Craig Bergstrom, Corbin Capital Partners
“Macro seems interesting now given a more turbulent political backdrop and what it means for both fiscal and monetary policy”
Jordan Brooks, Macro Strategies Group
“Inflation is now more balanced. From here, we think things are less certain across the board”
Carol Ward, Man Group
“We haven’t seen a lot of institutional investor demand on the solutions side for crypto trading strategies”
Edo Rulli, UBS Asset
“Larger exposures in non-specialist hedge funds are not there yet. Digital asset exchanges are not regulated and some carry reputational and fraud risk”
On ECB Must Stay Agile Cutting Rates in Uncertain World – Philip Lane
“In the current environment of elevated uncertainty, it is prudent to maintain agility on a meeting-by-meeting basis and not pre-commit to any particular rate path… In the event of downside shocks to the inflation outlook and/or to economic momentum, monetary easing can proceed more quickly”
Top Gainers and Losers- 19-December-24*

Go back to Latest bond Market News
Related Posts:
Brazil’s CSN Upgraded to B+ on Mining Unit’s IPO
February 22, 2021

Times China Downgraded to B+ by Fitch
March 11, 2022


