This site uses cookies to provide you with a great user experience. By using BondbloX, you accept our use of cookies.
Bond Market News
March Madness – Notional Loss Crossed $274bn; Bid-Ask Spreads Widened
April 1, 2020
A mad March if there ever was one. We took a dive into the data in our bond universe to see which sectors took the major hits last month in terms of total unrealized losses and price movements. Unsurprisingly, Sovereigns topped the charts for notional loss in March, so we did a breakdown to see which countries had the biggest impact. We also took the average bid-offer spread movements across the three months in 2020 to see how these have moved to get an idea of the liquidity changes in the market.
Uncrystallized losses for USD denominated bonds, calculated by multiplying the price change in March with the amount outstanding, shows that Sovereigns and Quasi-Sovereigns, Banks and Financial Services and the Energy sector took the biggest hit. Total uncrystallized loss for March stood at $274bn.

We compiled the sovereign bonds by country to show which country’s bonds fell the most. The table below is sorted by average price change in March.

As the month went on, clearly there was a lack of liquidity as volatility increased. Bid-offer spreads widened across the board. The airlines and transportation sectors saw the widest bid-offer spreads with the transportation sector widening from an average spread of 0.6 in Jan to 2.1 by the end of March.

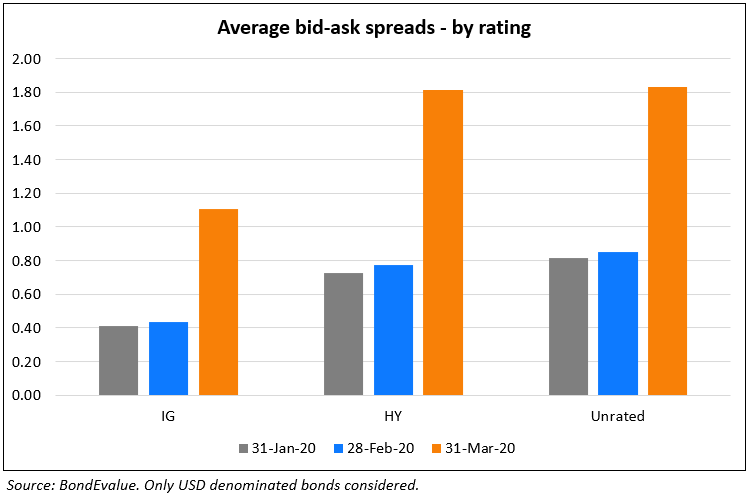
We also split the widening in bid-offer spreads by Investment Grade, High Yield and Unrated. As expected, High Yield and Unrated bonds saw a much greater widening in spreads as compared to Investment Grade bonds.

The average bid-offer spread by region is shown below. The change in Indian bonds is noteworthy.

Go back to Latest bond Market News
Related Posts:
Bank of Japan Tapers Purchases Prompting Bonds Sell-Off
September 23, 2018


BondbloX Pte. Ltd. is regulated by the Monetary Authority of Singapore as a Recognised Market Operator ("RMO") and exempted from Section 49(1) of the Securities and Futures Act (Cap. 289) ("SFA") under Section 49(7) of the SFA.