We use cookies to improve your experience. By using BondbloX, you agree to our use of cookies.
Bond Market News
Fed Cuts Rates by 50bp; Sep Dot Plot Guides for Further 50bp Cuts by end-2024
September 19, 2024
The FOMC announced an aggressive 50bp rate cut yesterday, marking a shift in policy aimed at bolstering the labor market. The new benchmark rate bounds now sit at 4.75-5.00%. The committee voted 11-to-1 in favor of a 50bp cut, with Michelle Bowman being the sole voter in favor of a 25bp cut. While the quantum seemed aggressive, Fed Chair Powell remarked that this does not signal a “new pace” in rate cuts moving forward, and that last night’s decision was based on the view that the risks to both employment and inflation are now roughly balanced. Markets are now betting on further 75bp of rate cuts by end-2024, based on the Implied Fed Funds Futures Rate.
The FOMC dot plot on the other hand guided for 50bp in cuts by end-2024, in-line with the 50bp in the June meeting’s dot plot, and a further 100bp in 2025.

Additionally, some key economic projections were revised. Unemployment rate at the end of 2024 was revised upwards to 4.4% from the prior 4% in June. The median forecast for inflation was revised downwards to 2.3%.
-1.png)
Looking at the chart above, Consumer Price Index (CPI) YoY has shown a notable decline over the period when interest rates crossed the 5% mark. During the same period, the unemployment rate has inched upward. Last month, Chicago Fed President Austin Goolsbee emphasized that FED officials would not react to just a single month’s data. However, persistent signs of labor market weakness, evidenced by the US NFP for August coming in at 142K against expectations of 165K and the downward revision of July’s NFP from 114K to 89K, have led officials to prioritize their labor market mandate. This move aims to prevent the unemployment surges seen in 2020 and 2009.
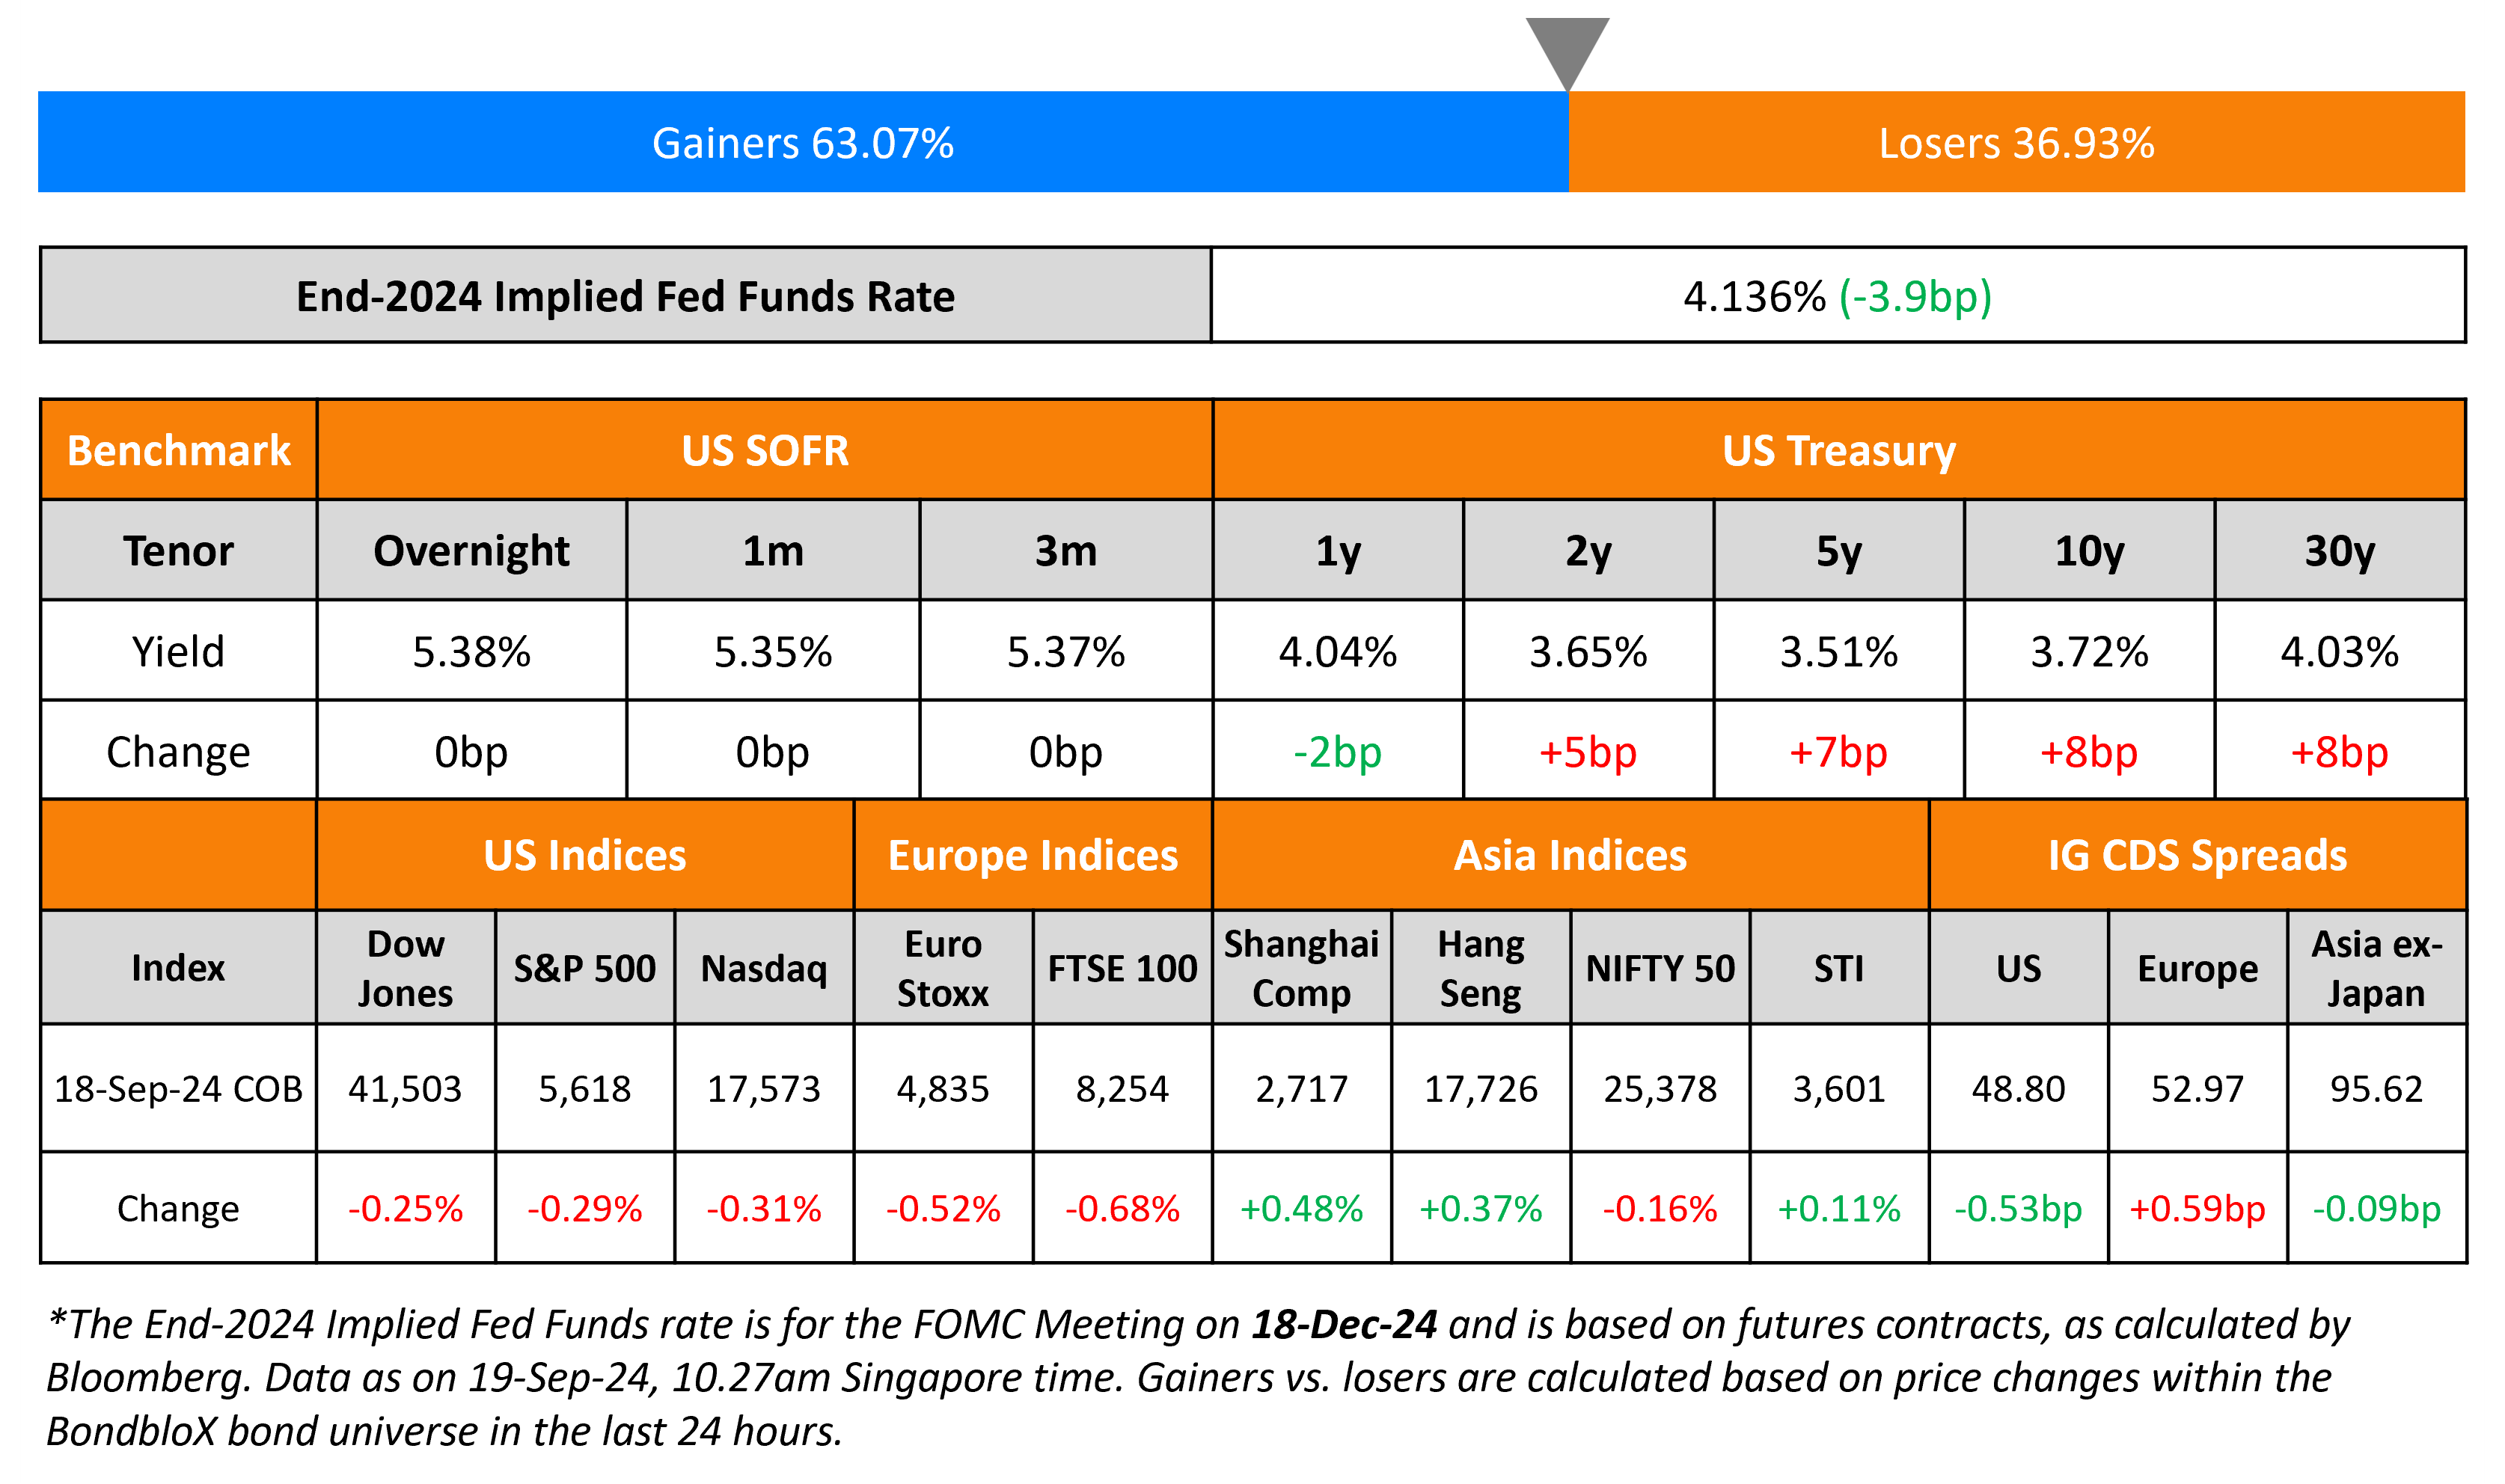
US Treasury yields rose across the curve by 5-8bp with 2Y closing at 3.65% and 10Y at 3.72%. US IG and HY CDS tightened by 0.5bp and 2.5bp respectively. Looking at US equity markets, both S&P and Nasdaq closed lower by 0.3% each. European equity markets also ended lower. Looking at Europe’s CDS, the iTraxx Main and Crossover spreads widened by 0.6bp each. Asian equity indices have opened higher today morning. Asia ex-Japan IG CDS spreads tightened by 0.1bp.
New Bond Issues
- OUE REIT S$ 7Y Green at 4.15% area

Rating Changes
- Fitch Upgrades Teva’s Long-Term IDR to ‘BB’; Outlook Positive
- Moody’s Ratings upgrades Omantel to Ba1 from Ba2; changes outlook to stable from positive
- Moody’s Ratings upgrades Costa Rica’s ratings to Ba3, maintains positive outlook
- Fitch Upgrades Five Turkish Corporate Issuers’ FC IDRs Following Sovereign Upgrade
- Moody’s Ratings upgrades Zurich Insurance Company Ltd’s IFSR to Aa2, stable outlook
- Moody’s Ratings upgrades Hellenic Bank’s long-term deposit ratings to Baa2 from Baa3, with positive outlook
- Coty Inc. Upgraded To ‘BB+’ On Revised Business Risk; Outlook Stable
- Fitch Downgrades TalkTalk to ‘C’ on Distressed Debt Exchange Announcement
- Moody’s Ratings downgrades CVR Energy’s CFR to B1; outlook negative
- Moody’s Ratings changes outlook of AXA SA to positive from stable and affirms its ratings
Term of the Day
Fed Dot Plot
The Fed dot plot is a visual representation of interest rate projections of members of the Federal Open Market Committee (FOMC), which is the rate-setting body within the Fed. Each dot represents the Fed funds rate for each year that an anonymous Fed official forecasts. The dot plot was introduced in January 2012 in a bid to improve transparency about the range of views within the FOMC. There are typically 19 dots for each year, representing the median rate of each voting member on the committee.
Talking Heads
On Junk Bond Investors Getting Ahead of Rate Cuts
Hunter Hayes, CIO at Intrepid Capital Management
“There’s a steady drumbeat to look for the next thing with yield that inevitably leads you to CCCs. That’s a dangerous dynamic and it’s the reason that you have to do your homework because inevitably there will be potentially some high-profile defaults within that CCC bucket.”
On Markets Getting Ahead of Itself on Fed
Daniel Ivascyn, CIO at Pacific Investment Management Co (PIMCO)
“We do think that the markets may be getting a little bit ahead of themselves in terms of near-term cuts. Over the course of the next few months there are some risks of reaccelerating inflation, which may lead to less cuts than are priced into the market.”
On Fed Cuts Being Positive for Credit
Jeff Grills, head of US cross markets and EM debt at Aegon Asset Management
“High yield issuers will have a new ability to come to market that they may not have had if they were just not quite as solid an issuer as the market desired. Now with this 50 basis point easing, investors will find BB and B high-yield names to be something that they’ll look to add to their portfolios.”
Top Gainers & Losers-19-September-24*

Go back to Latest bond Market News
Related Posts:
Our Awards


BondbloX Pte. Ltd. is regulated by the Monetary Authority of Singapore as a Recognised Market Operator ("RMO") and exempted from Section 49(1) of the Securities and Futures Act (Cap. 289) ("SFA") under Section 49(7) of the SFA.