We use cookies to improve your experience. By using BondbloX, you agree to our use of cookies.
Bond Market News
Fed Cuts by 25bp, Median Dots Project Only 1 Cut in 2026
December 11, 2025
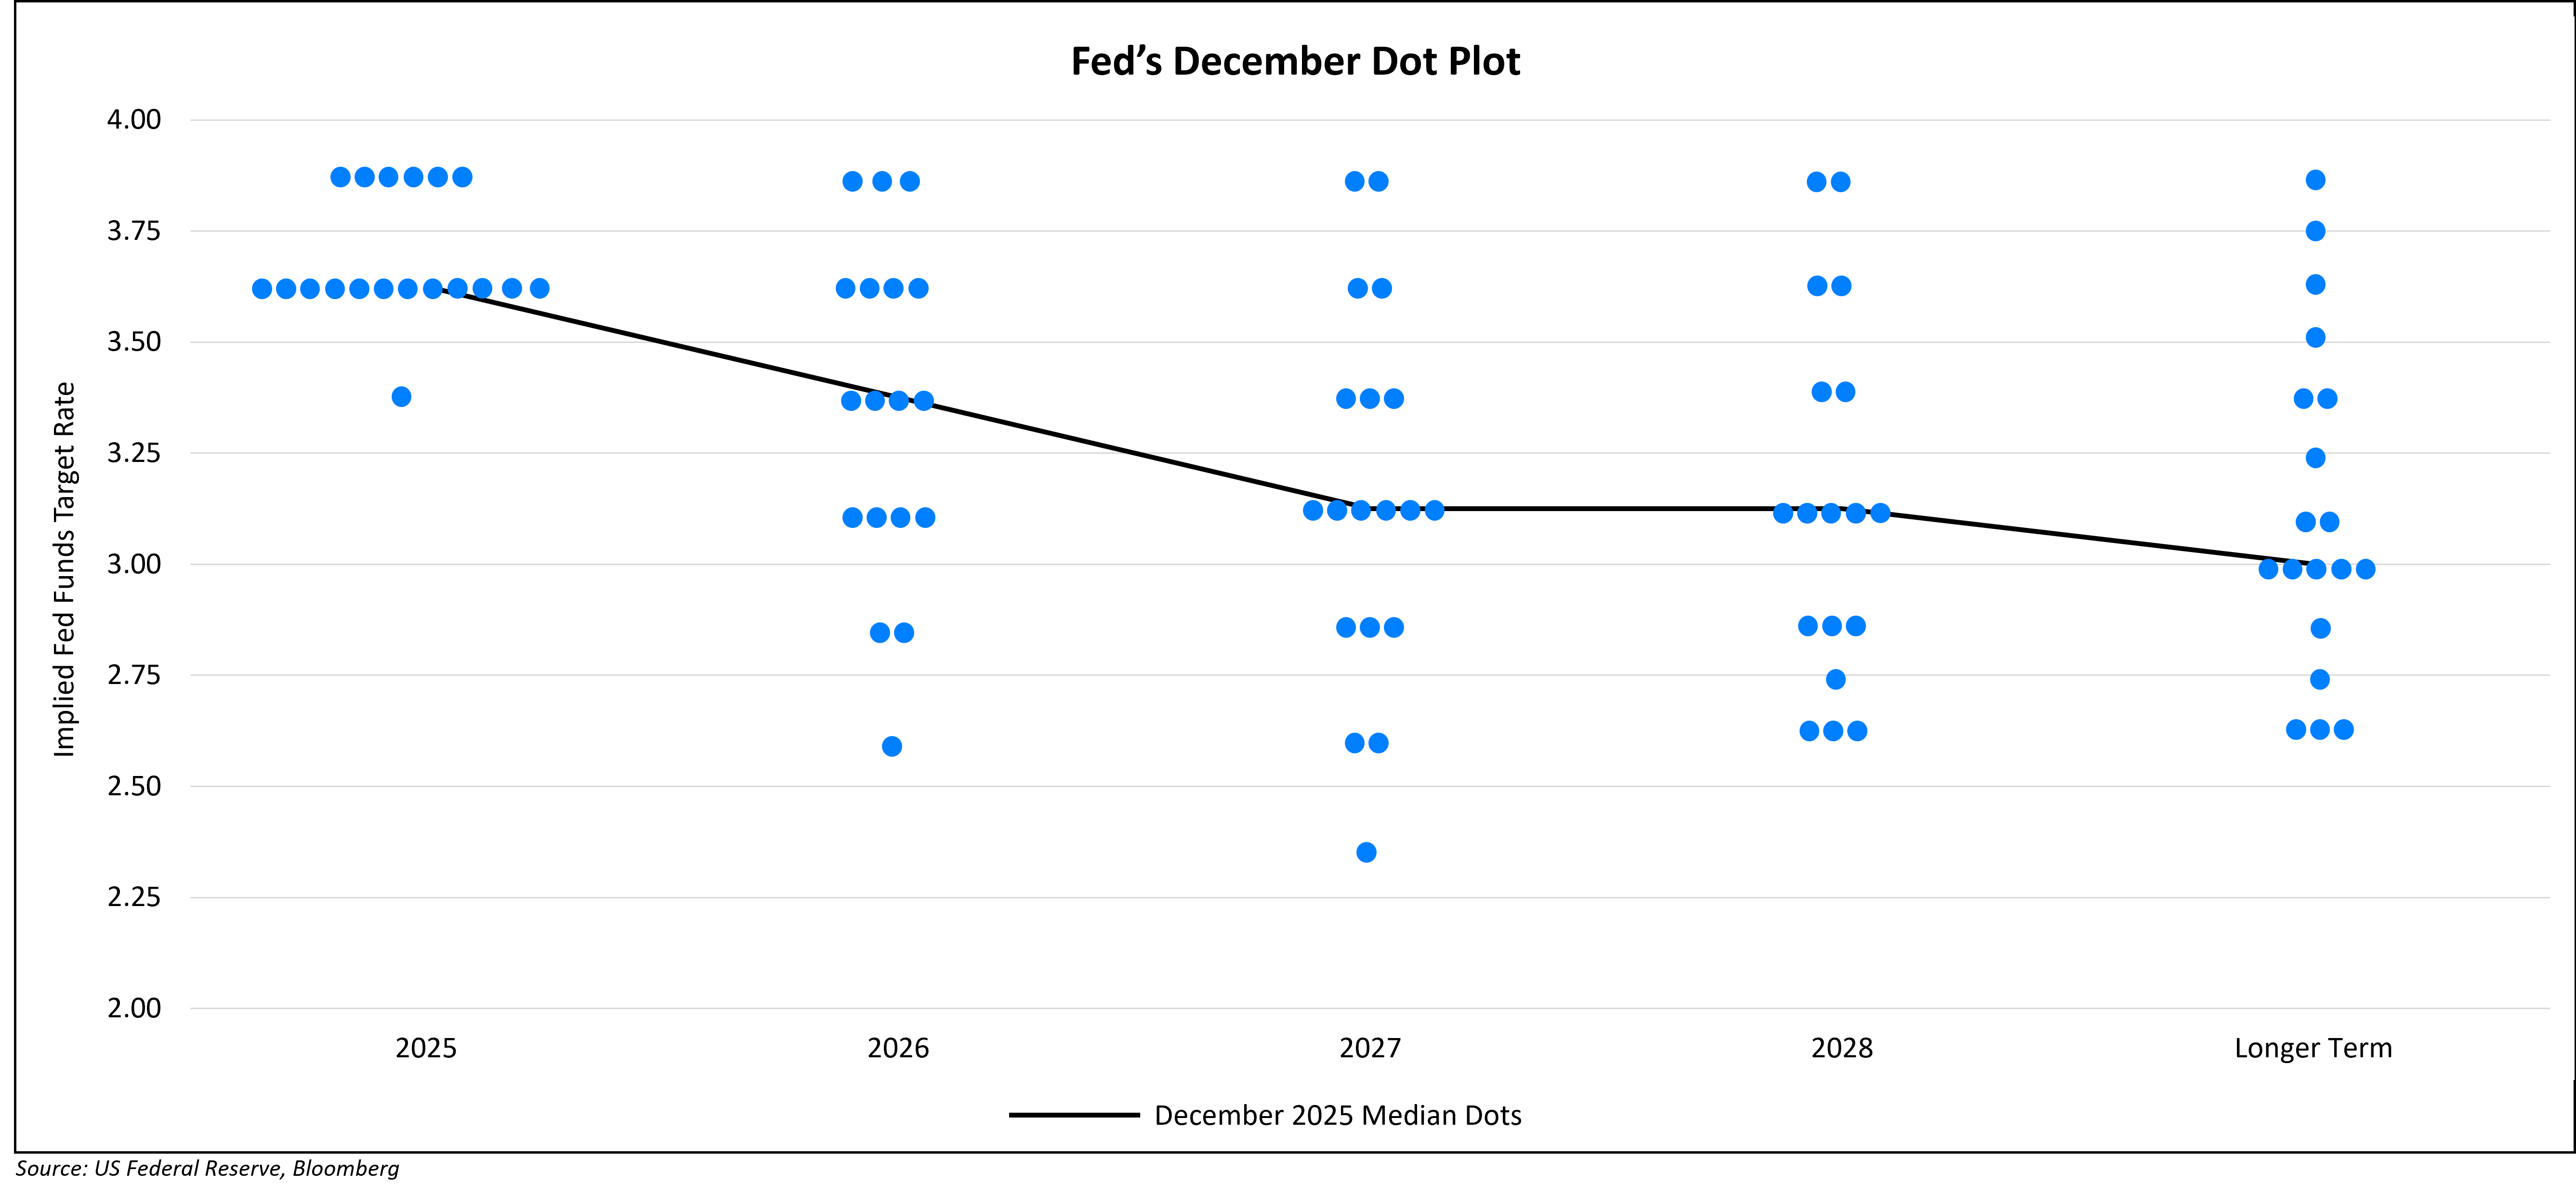
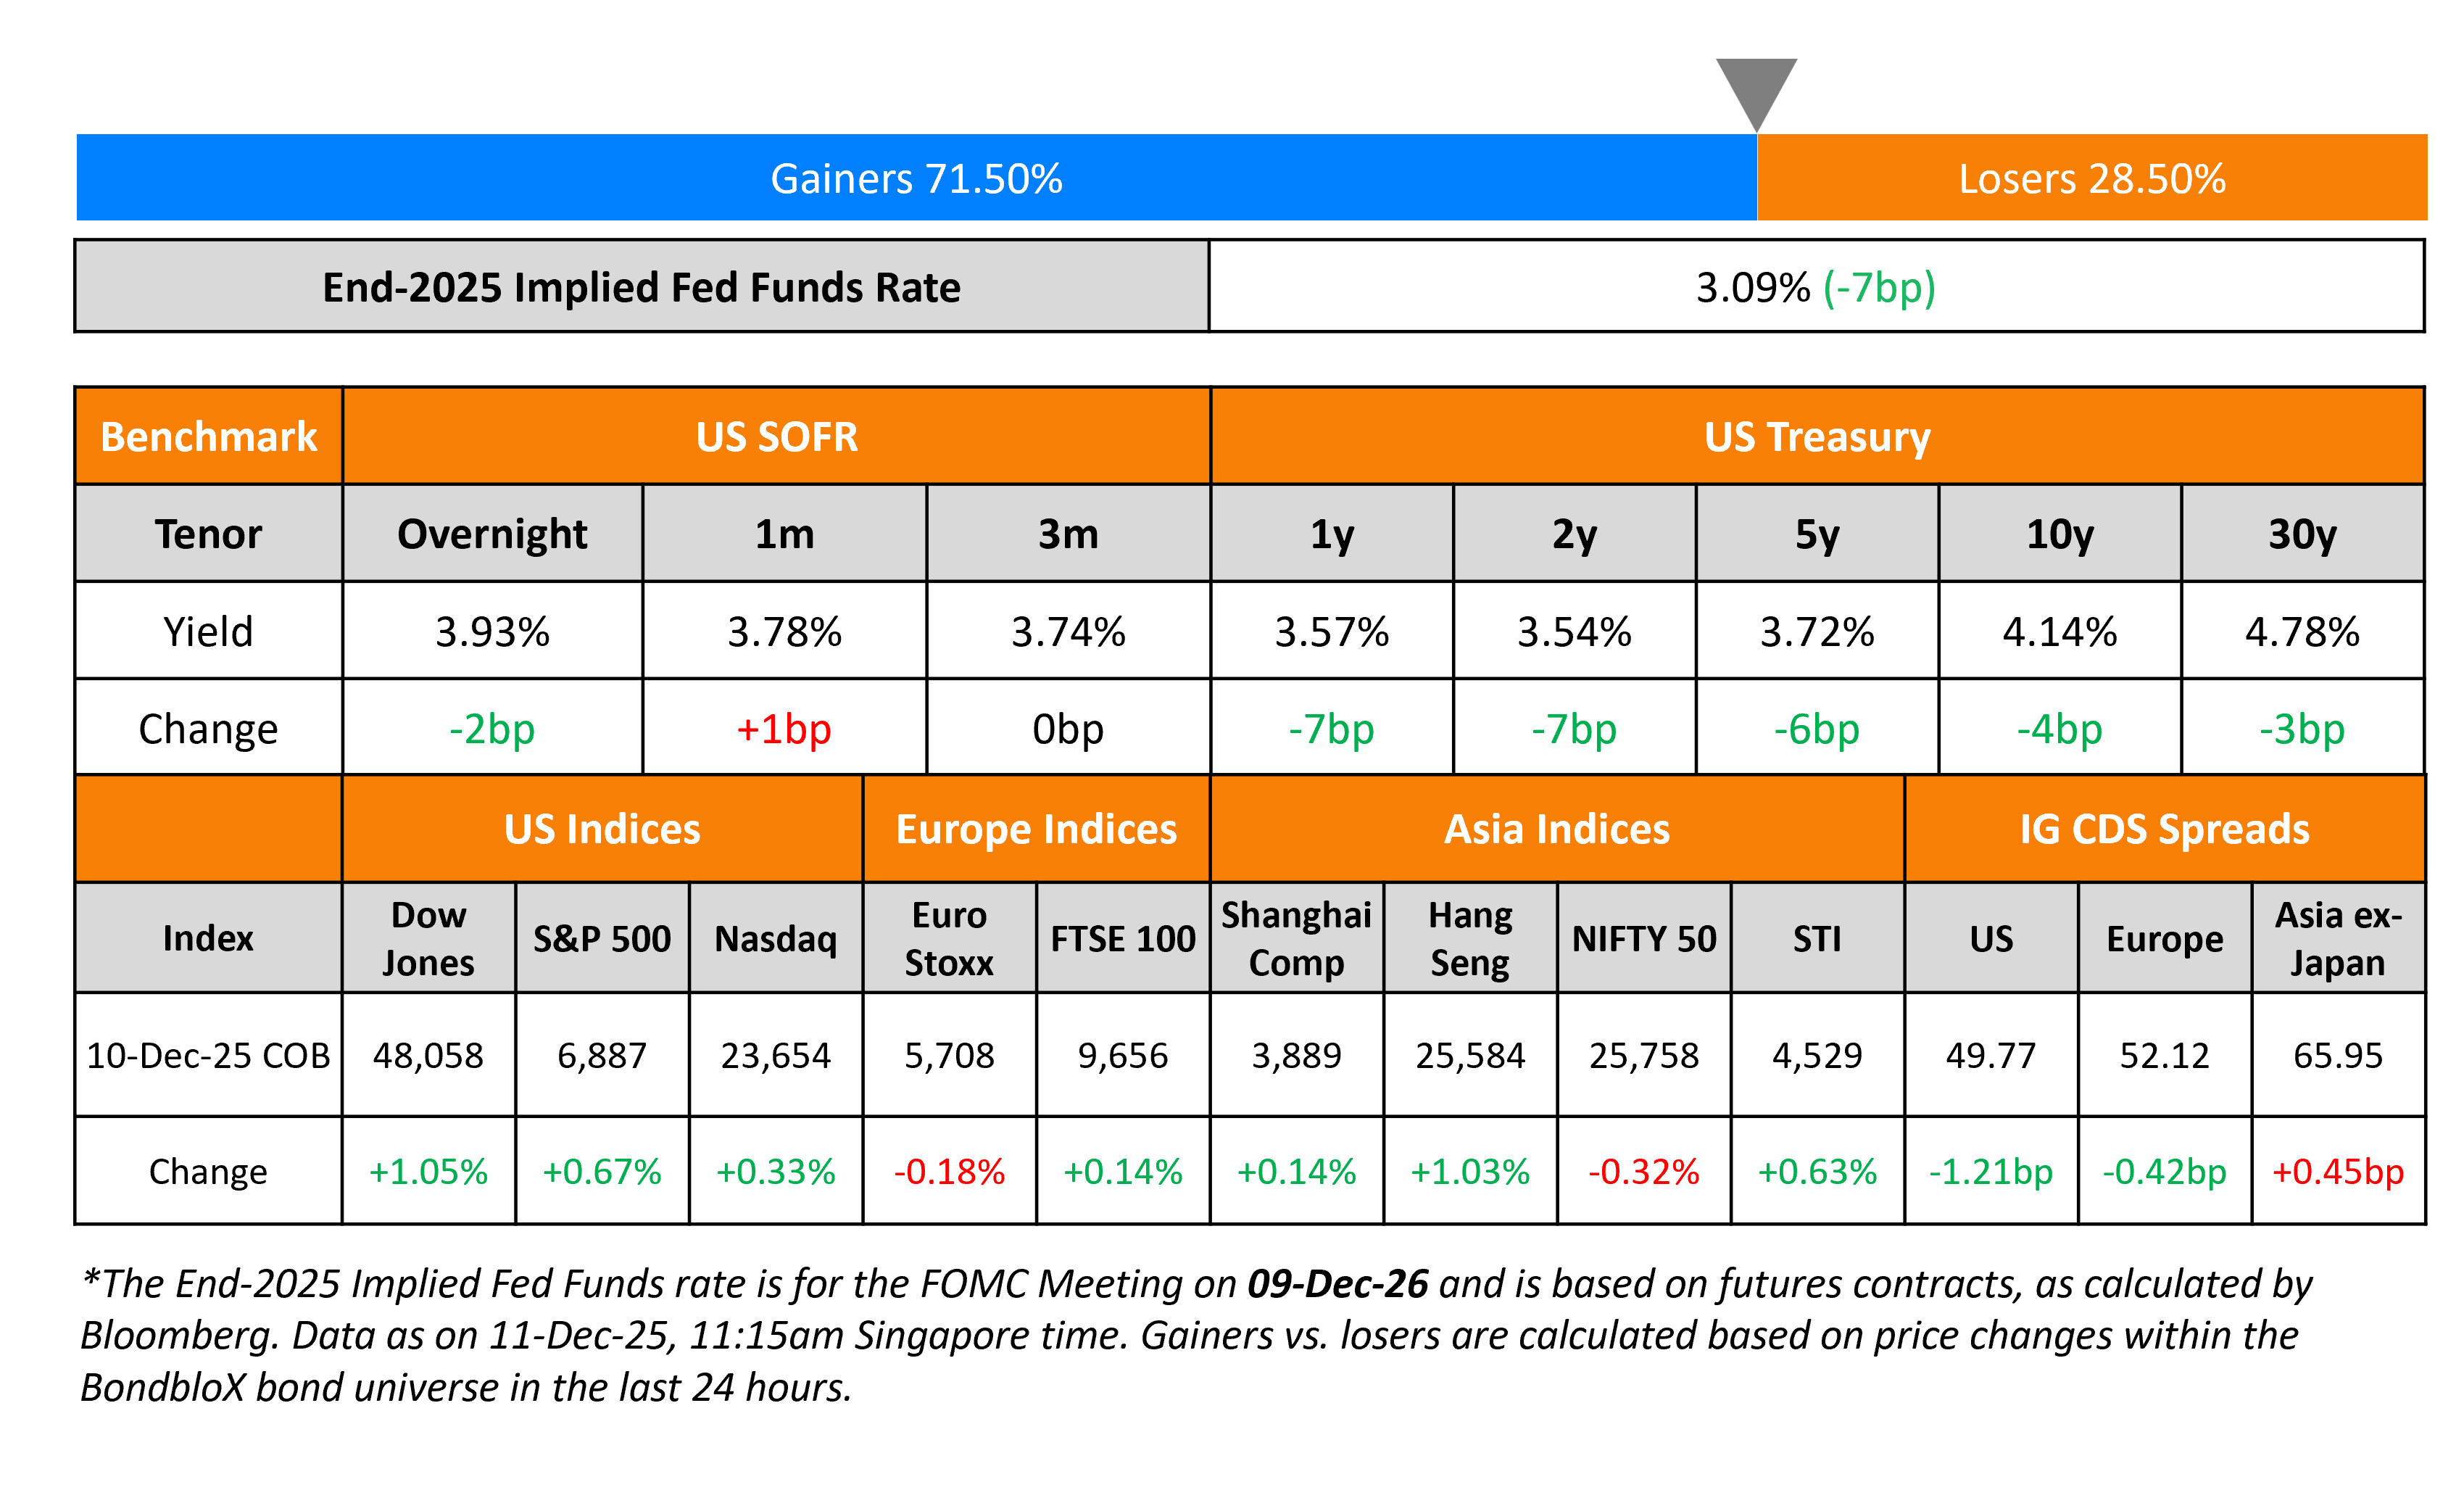
US Treasury yields fell across the curve – the 2Y yield fell by 7bp while the 10Y was down 4bp. The FOMC cut interest rates by 25bp as expected, with the Fed Funds Range now at 3.50-3.75%. The voting pattern saw 3 dissenters – Austan Goolsbee and Jeffrey Schmid preferred no change while Stephen Miran preferred a 50bp cut. The median dot plot over the next three years and the long-term was unchanged from September. As per the dot plot (above), the Fed is only penciling-in one rate cut in 2026. However, markets are still expecting two rate cuts by the Fed next year.
Looking at the Fed’s economic projections, GDP growth estimates were raised. It expects growth at 1.7% for 2025 (vs. 1.6% in September) and at 2.3% in 2026 (vs. 1.8% earlier). The unemployment forecast was unchanged for 2025 and 2026, at 4.5% and 4.4% respectively. Regarding inflation, its Core PCE estimate was revised slightly lower to 3.0% in 2025 (vs. 3.1% earlier) and to 2.5% in 2026 (vs. 2.6% earlier).
Fed Chairman Jerome Powell said that he does not view a rate hike as the base case next year. He also mentioned that the fed funds rate was “within a broad range of estimates of its neutral value”, with the future policy path being data-dependent. Separately, the Fed said that reserve balances had declined to “ample levels” and that it will initiate purchases of shorter-term Treasury securities as needed.
Looking at US equity markets, the S&P and Nasdaq ended 0.7% and 0.3% higher respectively. US IG CDS spreads were 1.2bp tighter and HY spreads tightened by 7.2bp. European equity indices ended mixed. The iTraxx Main CDS spreads tightened by 0.4bp while the Crossover CDS spreads were 1.2bp tighter. Asian equity markets have opened weaker this morning. Asia ex-Japan CDS spreads were 0.5bp wider.
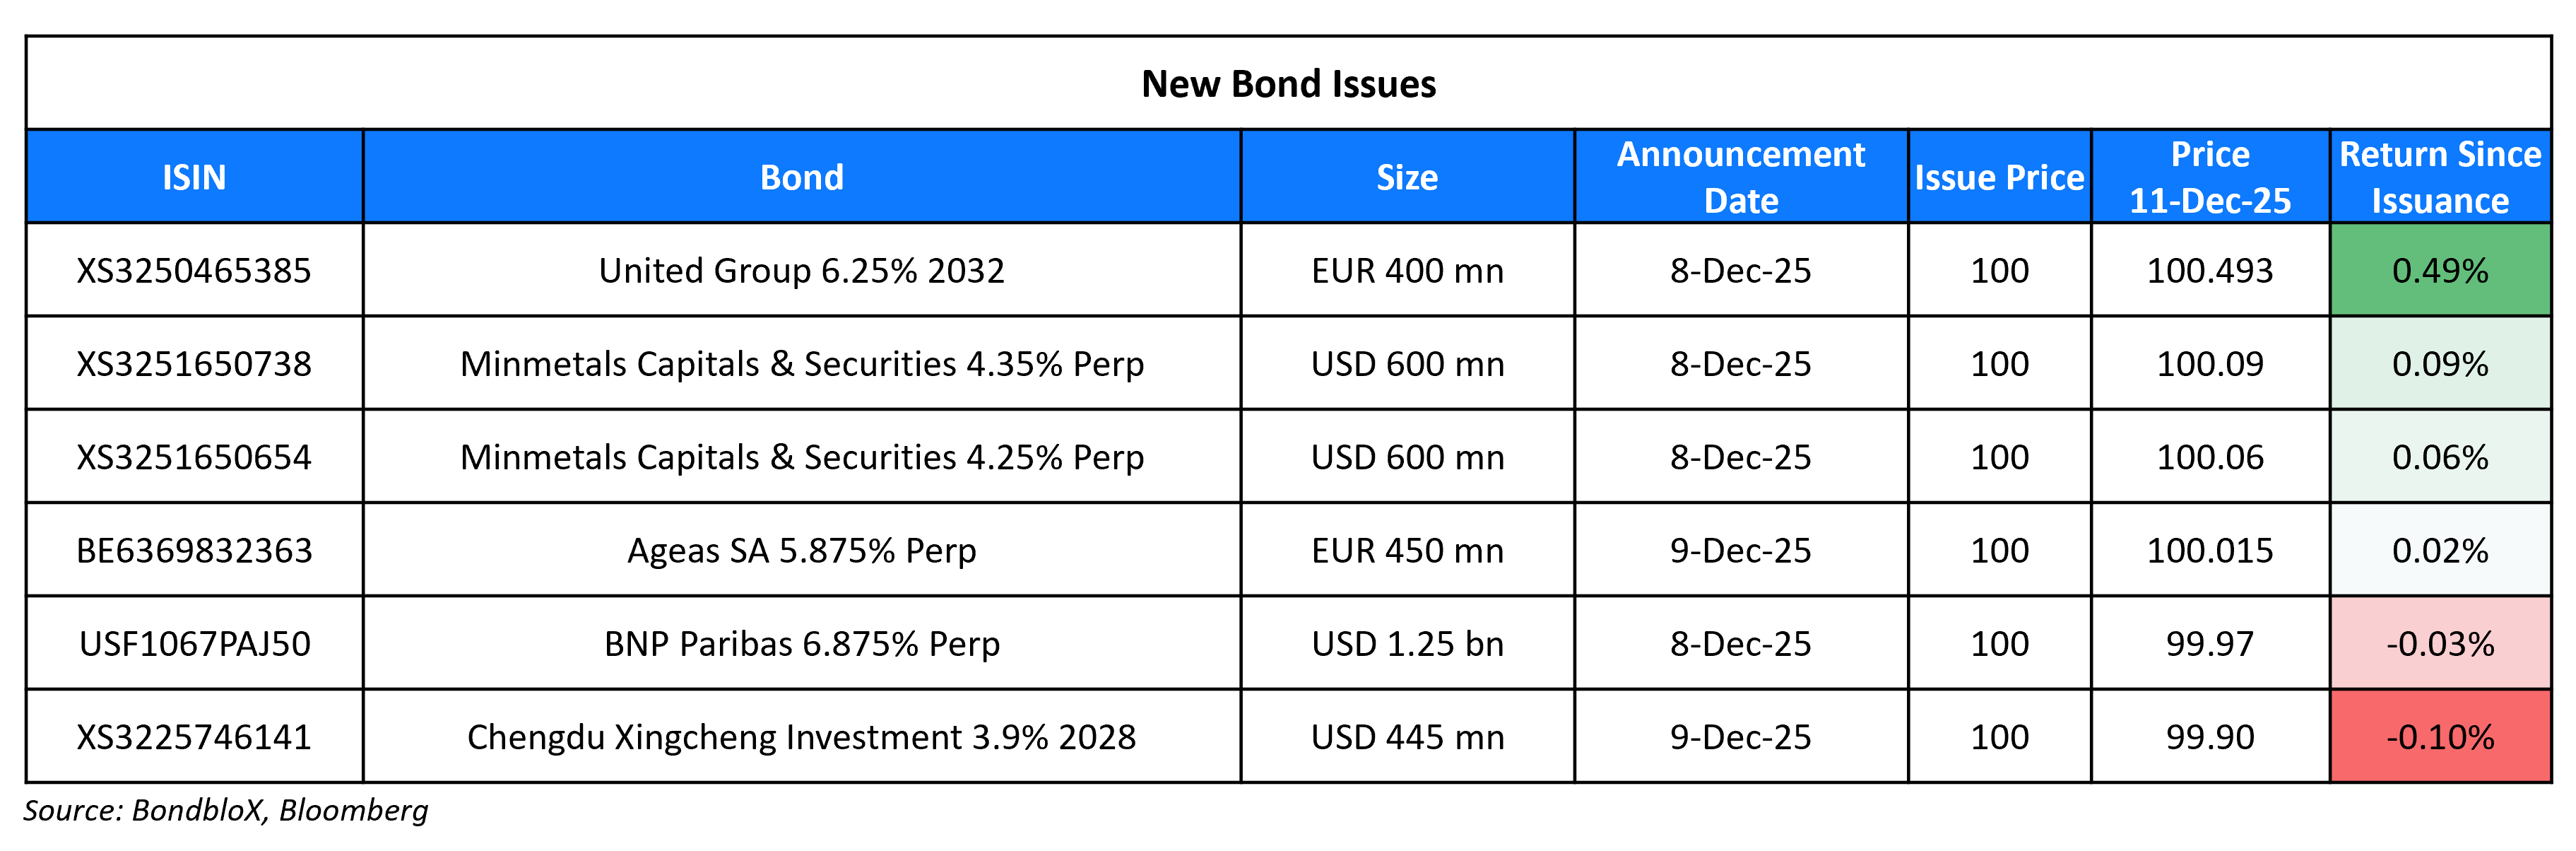
New Bond Issues
Rating Changes
- Moody’s Ratings upgrades West China Cement’s CFR to B3, concluding review; outlook positive
- Newfold Digital Holdings Group Inc. Upgraded To ‘CCC’ From ‘D’; Rating Placed On CreditWatch Positive
- Moody’s Ratings upgrades Petra Diamonds’ CFR to Caa1; outlook stable
- Moody’s Ratings downgrades INEOS’ rating to B2; outlook negative
- Moody’s Ratings downgrades INEOS Quattro Holdings Ltd’s ratings to B3; outlook remains negative
- Fitch Downgrades Televisa’s Ratings to ‘BB+’; Outlook Stable
- Fitch Downgrades The Campbell’s Company to ‘BBB-‘/’F3’; Outlook Stable
- Biocon Biologics Ratings Placed On CreditWatch Positive On Accelerated Debt Reduction
Term of the Day: Fed Dot Plot
The Fed dot plot is a visual representation of interest rate projections of members of the Federal Open Market Committee (FOMC), which is the rate-setting body within the Fed. Each dot represents the Fed funds rate for each year that an anonymous Fed official forecasts. The dot plot was introduced in January 2012 in a bid to improve transparency about the range of views within the FOMC. There are typically 19 dots for each year, representing the median rate of each voting member on the committee.
Talking Heads
On Inflows and Carry Will Revive EM Asian Bonds
Abhay Gupta, BofA Securities
“Indonesia, Philippines and India offer the best real yields in the region, and we remain bullish on the five-year bonds in these countries on scope for further monetary easing”
Homin Lee, Lombard Odier
“Positioning is still light in emerging Asia’s local currency bond market… nascent recovery in inflows in emerging Asia will become more substantial next year”
On Investors expecting relief in money markets as Fed resumes T-bill purchases
Robert Tipp, PGIM Fixed Income
“I think it’s a positive development in that over time, you do need to have the Fed in an expanding balance sheet position… important to have people doing arbitrage between Treasuries and futures to keep the market sufficiently liquid”
Stephen Douglass, NISA Investment Advisors
“The reason they made it now is that pressure in the repo market, with repo trading above the administered rates, continued into early December, even after QT was formally concluded on December 1”
On Yuan Debate, Warning on Risks of Trade Tensions – IMF Managing Director Kristalina Georgieva
“As the second-largest economy in the world, China is simply too big to generate much growth from exports. Continuing to depend on export-led growth risks furthering global trade tensions… What we want to see is a market-based exchange rate that reflects fundamentals”
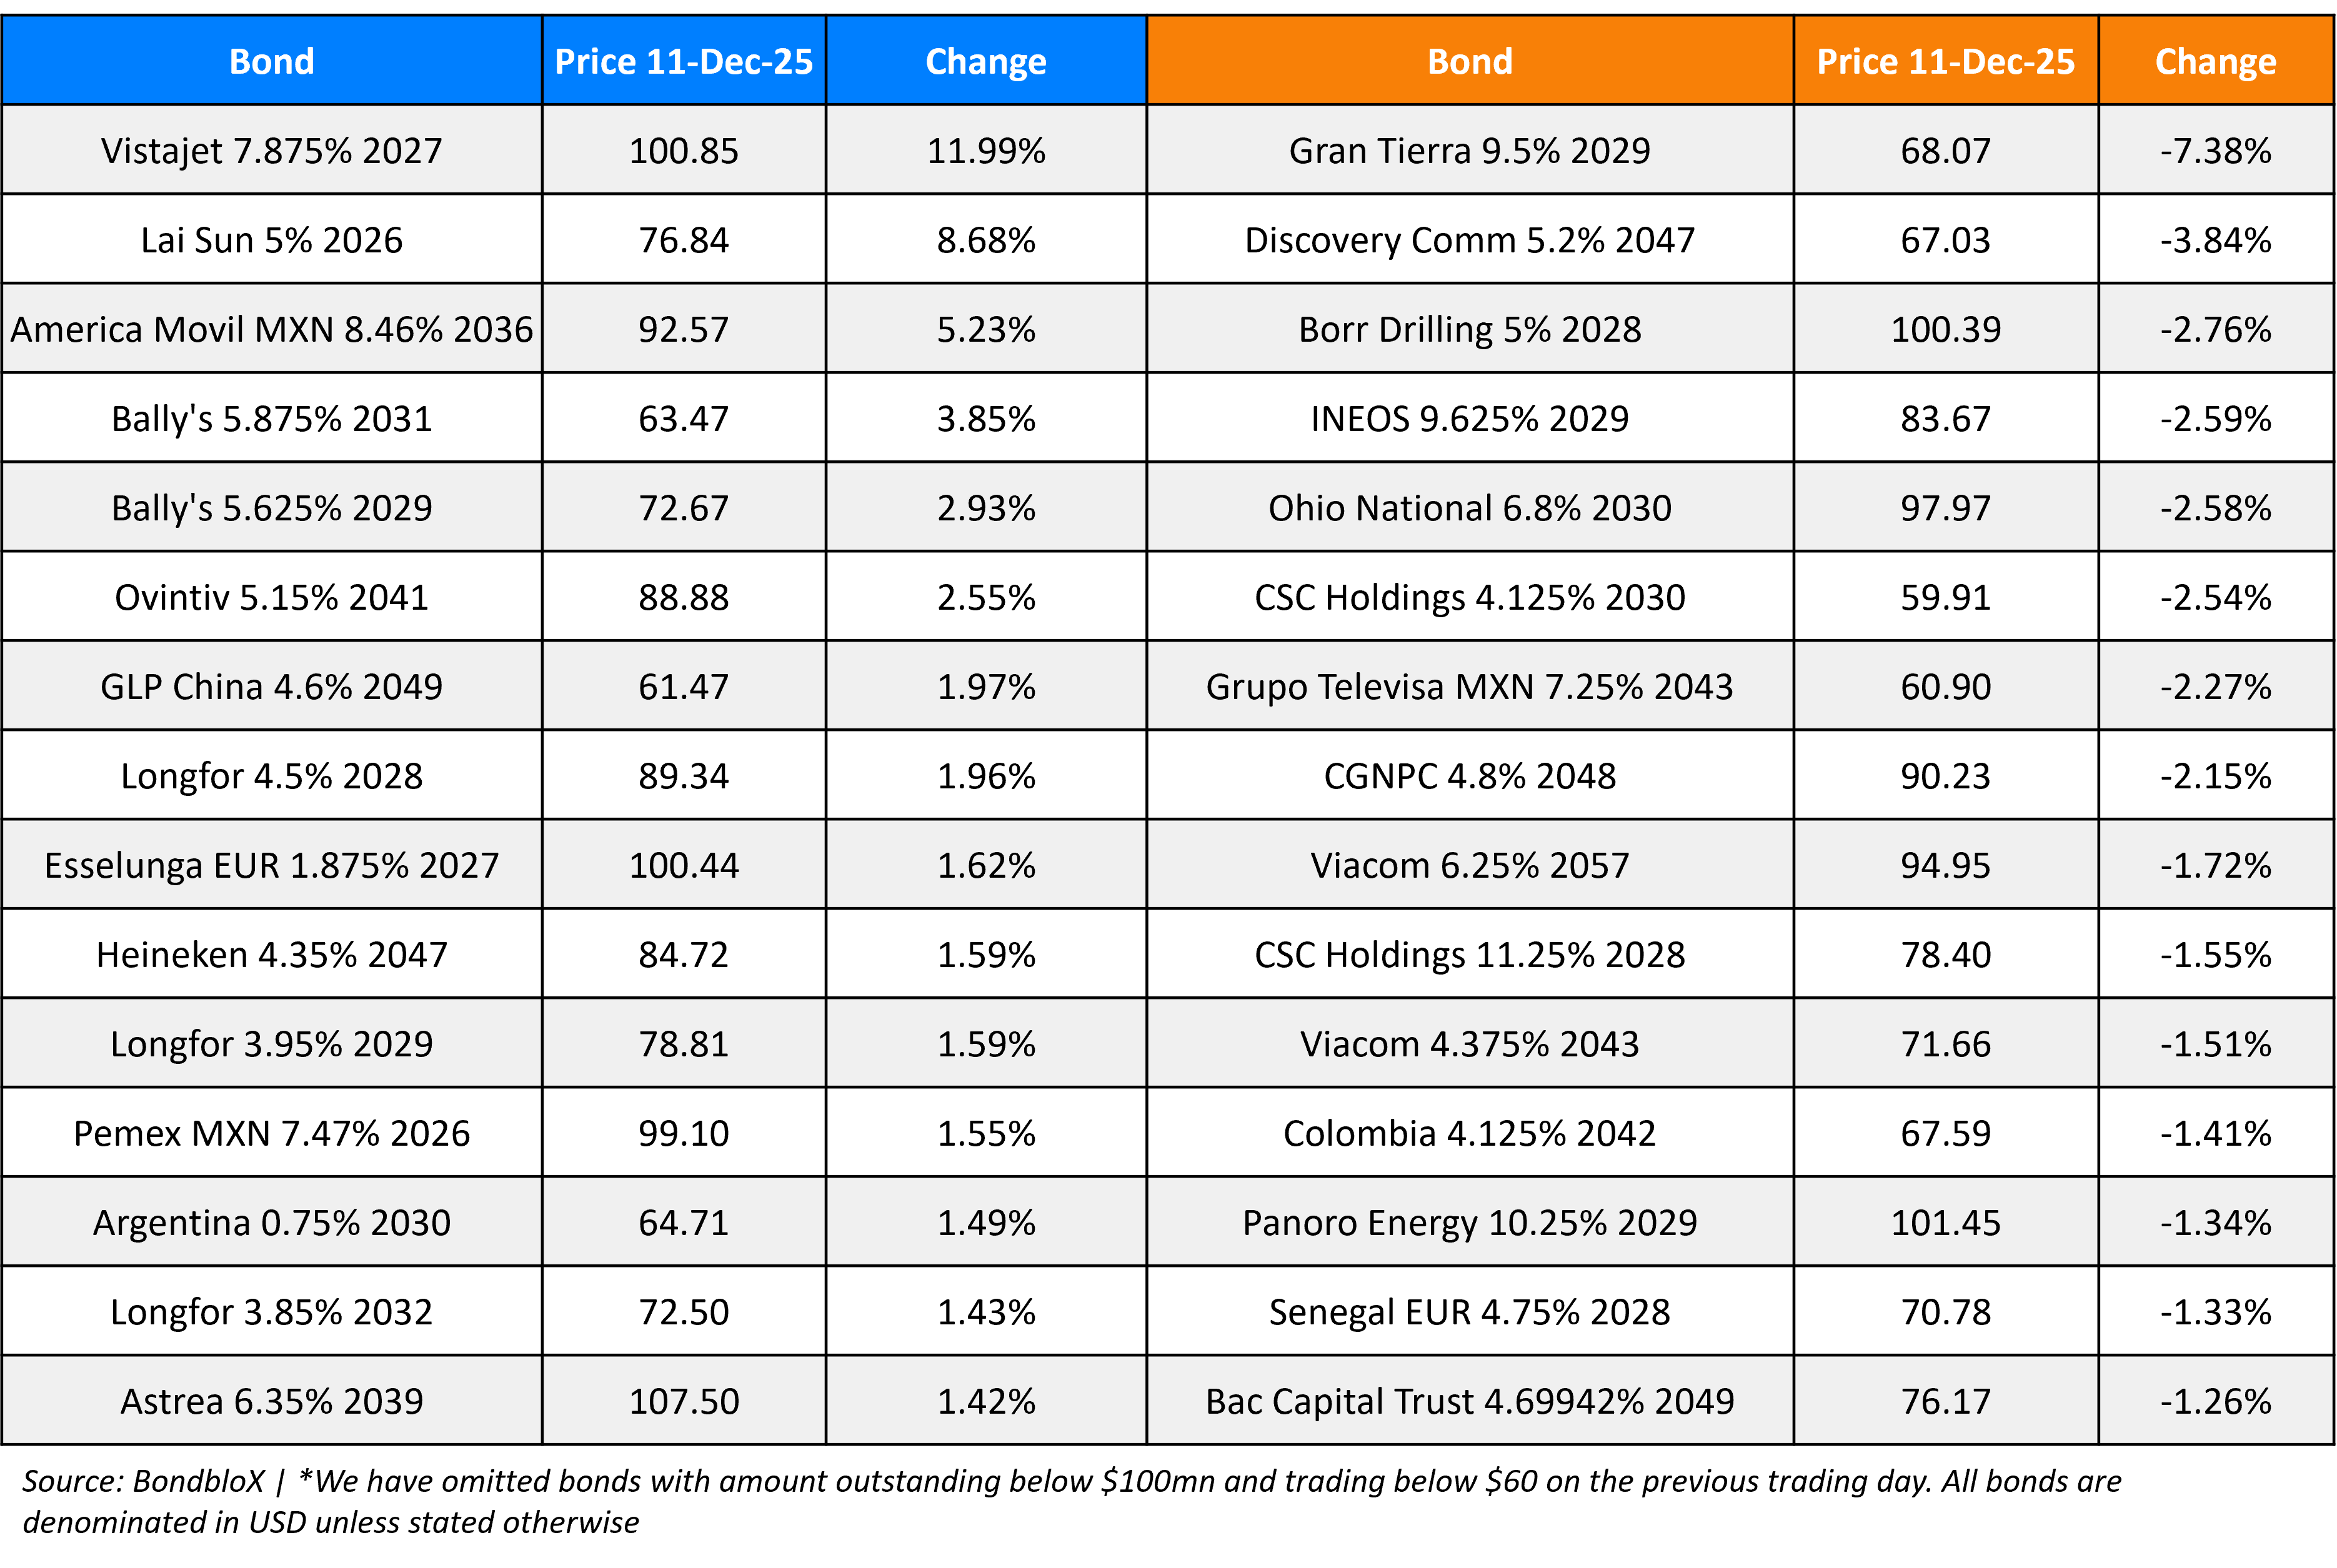
Top Gainers and Losers- 11-Dec-25*
Go back to Latest bond Market News
Related Posts: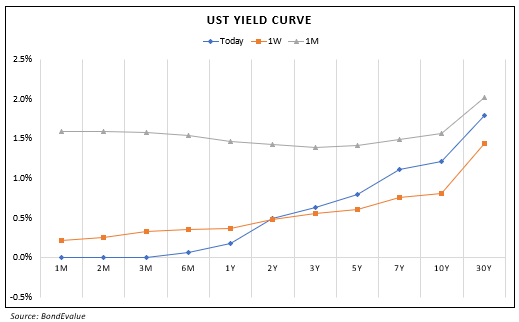


Our Awards


BondbloX Pte. Ltd. is regulated by the Monetary Authority of Singapore as a Recognised Market Operator ("RMO") and exempted from Section 49(1) of the Securities and Futures Act (Cap. 289) ("SFA") under Section 49(7) of the SFA.