This site uses cookies to provide you with a great user experience. By using BondbloX, you accept our use of cookies.
Bond Market News
Bond Investors Take Flight to Safety Amid Trade War Tensions
June 6, 2019
The month of May was characterized by heightened trade tensions between US and China, as both superpowers failed to arrive at an agreement during trade talks held in Washington. The escalation in geopolitical risk spooked global markets as investors took flight to safety, pushing benchmark bond yields lower.
The 10-year US Treasury yield has fallen to 2.10%, 113 basis points from its 8-year peak of 3.23% in October of last year. In fact, investors can now earn a higher yield on the 3-month Treasury as compared to the 10-year Treasury, implying an inverted Treasury yield curve. In the chart below, we have plotted the spread between the 10-year and 3-month Treasury yields since 1995.

As can be seen, and highlighted by us a few months back, an inverted yield curve has preceded the financial crisis of 2007, the dot-com bubble in 2001 and the early 1990s recession. This explains the cause of concern for investors today and why they have been flocking towards safer assets over the world.
During the month of May, the 10-year German government bond yield fell 22 basis points to a record low of negative 0.21%, while the 10-year Japanese government bond yield fell by 6 basis points to negative 0.10%.
The slump in global benchmark bond yields has put pressure on central banks to cut interest rates in the hopes of reviving economic growth and inflation.

In the stacked bar chart above, we have plotted the FOMC meeting dates on the X-axis and futures implied Fed Funds rate probability on the Y-axis. We can see that for the next FOMC meeting on 19-Jun, markets are pricing in no change in the Fed Funds rate (75% probability).
However, as we move through 2019, we can see that markets are pricing a greater probability of a rate cut. Looking at the stacked bar for 11-Dec-19, we see that there is an 83% probability of a rate cut of at least 50 basis points (summing the probabilities of a rate cut of and greater than 50bps).
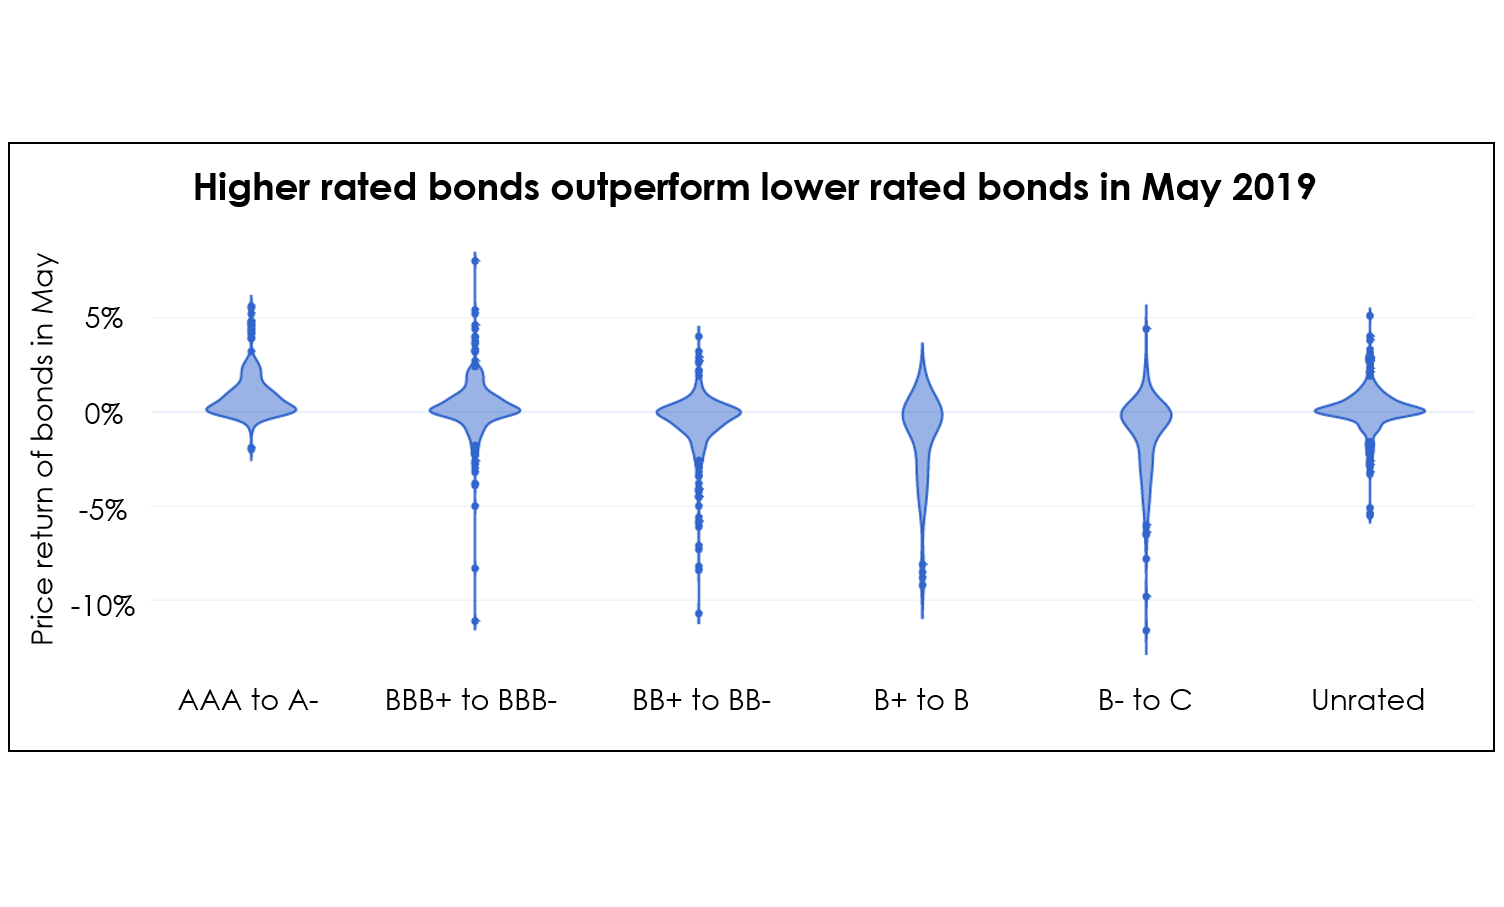
Price Return in May – Flight to Safety
Of the bonds in the BEV universe, 51% yielded a positive price return while 49% delivered a negative price return in May. In the violin chart below, we have plotted the price returns vs. bond ratings, with each point or dot representing a bond.

We can see that most bonds rated AAA to A- had a positive price return in May. In contrast, bonds rated BB+ to BB-, B+ to B and B- to C all had more bonds with a negative return than with a positive return, especially when looking at bonds that returned -5% and lower.
In Pursuit of Yields
In the scatter plot below, we have plotted all bonds in the BEV universe with a positive price return in May, with bond duration on the X-axis and the price return on the Y-axis. Each point or dot represent a bond. The orange points represent bonds with a duration of greater than 10 years and a price return of greater than 2% in May.

It is clear from the scatter plot that bonds with a higher duration performed better in terms of price as compared to bonds with a shorter duration. Further, longer-tenor sovereigns such as South Korea 3.875% 2048, China 4% 2048, Malaysia 4.08% 2046 and Temasek 5.375% 2039 stood out with 1-month price returns of 3-5%.
This indicates that investors took on duration risk in pursuit of yields, albeit with lower perceived credit risk given the preference for sovereigns and higher rated corporates.
Asia ex-Japan G3 Issuance
Issuance volume normalized in May with a total of $25.6 billion as compared to $38.3 billion in April and an average of $27.0 billion for 1Q19. After a record high of $11.7 billion in April, Asia ex-Japan G3 currency high-yield issuance volume dropped to $7.0 billion.
Macau casino operator MGM China raised $1.5 billion split equally between two tranches with maturities in 2024 and 2026. The bonds, rated BB- by S&P, traded up in secondary markets returning over 2% since issuance.
Hong Kong received an overwhelming response for its first ever green bond sale, with orders exceeding $4 billion for the $1 billion 5% USD-denominated bond maturing in 2024. The bond was issued as part of Hong Kong’s HK$100 billion green bond program.

Largest Deals in May 2019* (ranked by performance)

Top Gainers & Losers – May 2019*

As seen in the scatter plot earlier, high-quality corporates and sovereigns outperformed in price terms in May.
Rallye, parent of French retailer Casino, entered bankruptcy protection of the French courts in a bid to freeze its debt and avoid bankruptcy for up to 18 months. The company’s bonds tanked on the news with Rallye’s 4% 2021 bonds losing over 50 percentage points to trade at 28 cents on the Euro.
Hong Kong listed Bank of Jinzhou’s perpetual bonds dropped to 65 cents on the dollar on news of its auditor Ernst & Young resigning after it found out that some of the loans to institutional customers were not used for the stated purpose. This comes just days after the Chinese banking regulator took control over Inner Mongolia based Baoshang Bank on account of “serious credit risks”.
Go back to Latest bond Market News
Related Posts:


BondbloX Pte. Ltd. is regulated by the Monetary Authority of Singapore as a Recognised Market Operator ("RMO") and exempted from Section 49(1) of the Securities and Futures Act (Cap. 289) ("SFA") under Section 49(7) of the SFA.